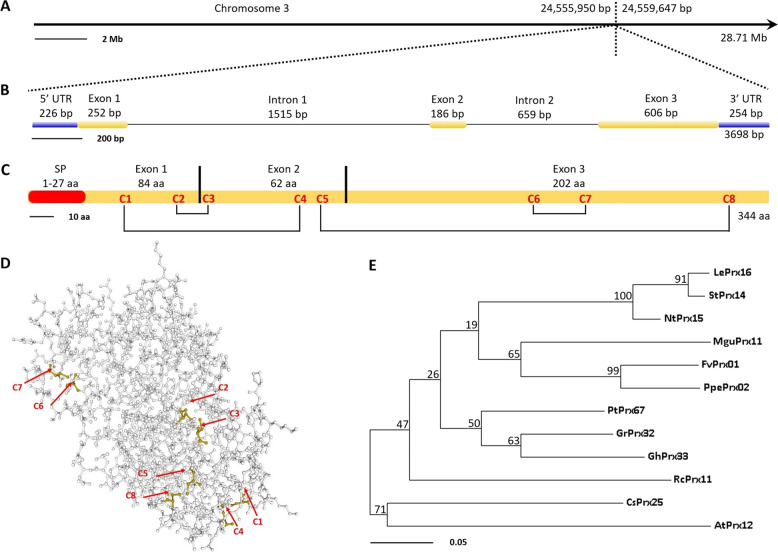
Fig. 1. Bioinformatics features of CsPrx25.
a CsPrx25 chromosomal locus obtained via CAP. b Exons and introns of CsPrx25 obtained through GSDS V2.0. The blue rectangles represent untranslated regions (UTRs) at the 5′ and 3′ ends; the yellow rectangles represent exons; and the blank lines represent introns. c Schematic of the signal peptide and cysteines (C1–C8) of CsPrx25. The disulfide bonds formed by the cysteine residues are joined by lines. The signal peptide was predicted using SignalP V4.0. d 3D model of CsPrx25 predicted by Phyre V2.0. The cysteine residues are labeled with red arrows and C1–C8. e Maximum-likelihood (ML) phylogeny of CsPrx25 and its orthologs in several organisms. The ML tree was constructed using the CIII Prx sequences of Lycopersicon esculentum (LePrx16), Solanum tuberosum (StPrx14), Nicotiana tabacum (NtPrx15), Mimulus guttatus (MguPrx11), Fragaria vesca (FvPrx01), Prunus persica (PpePrx02), Populus trichocarpa (PtPrx67), Gossypium raimondii (GrPrx32), Gossypium hirsutum (GhPrx33), Ricinus communis (RcPrx11), A. thaliana (AtPrx12) and C. sinensis (CsPrx25) with MEGA V7.0 (bootstrap: 500, Poisson model). The clustering of the taxa is shown through the percentages of trees displaying clusters. The branches are drawn to scale, and each length is representative of the number of substitutions at each site

