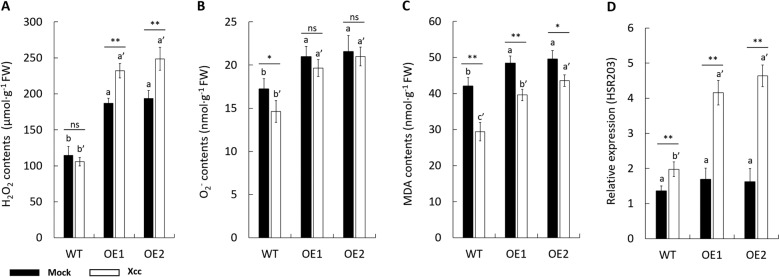
Fig. 5. CsPrx25 reconstructs ROS homeostasis and imparts HR sensitivity during Xcc infection.
The levels of H2O2 (a), O2.− (b) and MDA (c) in OE and WT plants were assayed at 12 h after mock inoculation (ddH2O; filled bars) and Xcc infection (open bars). In a–c, FW: fresh weight. d CsHSR203 transcript levels in WT vs. OE plants at 12 h after mock (ddH2O) (filled bars) or Xcc inoculation (open bars). The data were normalized to the CsActin levels. In a–d, the differences between the mock- and Xcc-infected samples were analyzed by Fisher’s LSD test, *P < 0.05; **P < 0.01. The differences between the OE and WT plants were analyzed using Tukey’s HSD test (P = 0.05; n = 3)

