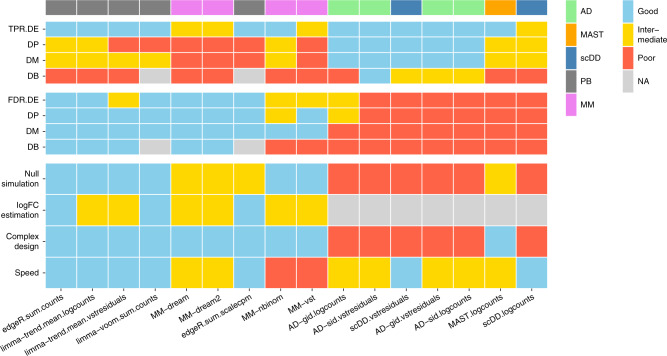
Fig. 5. Summary of DS method performance across a set of evaluation criteria.
Methods are ranked from left to right by their weighted average score across criteria, with the numerical encoding good = 2, intermediate = 1, and poor/NA = 0. Evaluation criteria (y-axis) comprise DS detection sensitivity (TPR) and specificity (FDR) for each type of differential distribution, uniformity of p value distributions under the null (null simulation), concordance between simulated and estimated logFCs (logFC estimation), ability to accommodate complex experimental designs (complex design), and runtimes (speed). Top annotation indicates method types (PB pseudobulk (aggregation-based) methods, MM mixed models, AD Anderson–Darling tests). Null simulation, logFC estimation, complex design, and runtimes received equal weights of 0.5; TPR and FDR were weighted according to the frequencies of modalities in scRNA-seq data reported by Korthauer et al.33: ~75% unimodal, ~5% trimodal, and ~25% bimodal, giving weights of 0.75 for DE, 0.125 for DP and DM, and 0.05 for DB.

