Figure 2.

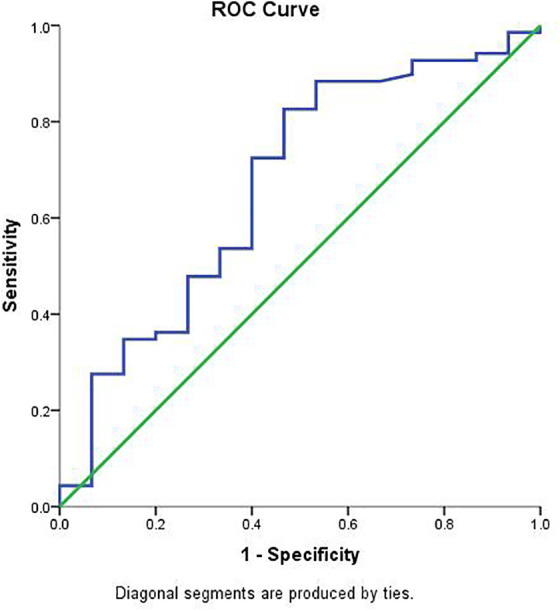
ROC curve was obtained by plotting the relationship between the specificity and the sensitivity at different cut-off levels of the serum VEGF-A.

ROC curve was obtained by plotting the relationship between the specificity and the sensitivity at different cut-off levels of the serum VEGF-A.