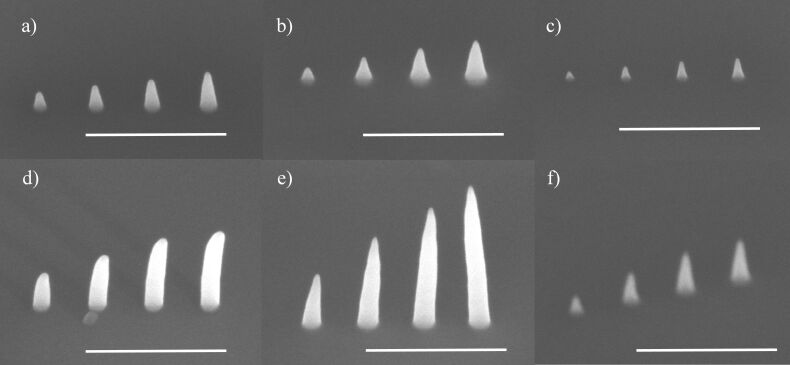
Figure 6.
Comparison of pillars grown in experiment 2 from all three precursors a) and d) MeCpPtMe3, b) and e) Pt(CO)2Cl2, and c) and f) Pt(CO)2Br2. The dwell times for each pillar were 0.5, 1, 1.5 and 2 ms (left to right) and this was repeated for 200 passes. a), b), and c) are deposited at 12 pA. This corresponds to electron doses of 7.5, 15, 22.5, and 30 × 106 electrons. d), e) and f) are deposited at 38 pA, corresponding to electron doses of 24, 47, 71 and 95 × 106 electrons, respectively. All scale bars are 500 nm.

