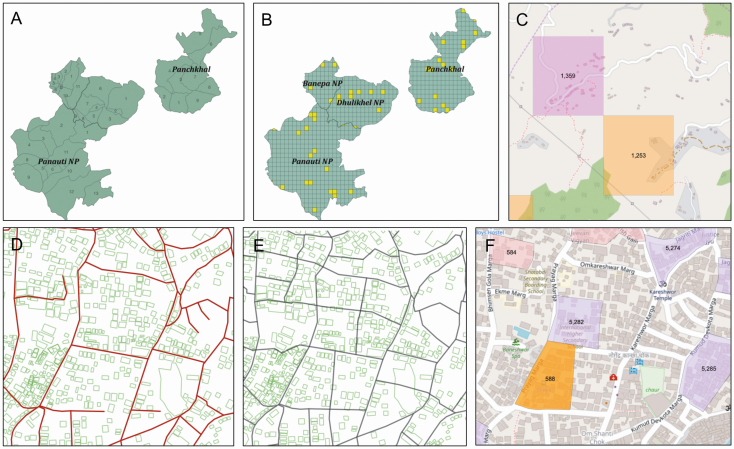
Figure 2.
A–C, Kavrepalanchok District with labeled catchment municipalities and wards (A), with grid overlay and example random selection of grid squares chosen in yellow (B) and with zoomed view of 2 selected grids and their underlying house and road structure, using an OpenStreetMap base map (C). D–F, Kathmandu Municipality zoomed to 1:9000 scale, with underlying road infrastructure (red) and building footprints (green) outlined (D), road-based clusters constructed (black outlines) (E), and sample selected clusters (purple and orange) overlaid on an OpenStreetMap base map (F); D, E, and F all depict the same region. Numbers in (C) and (F) indicate assigned cluster study ID.

