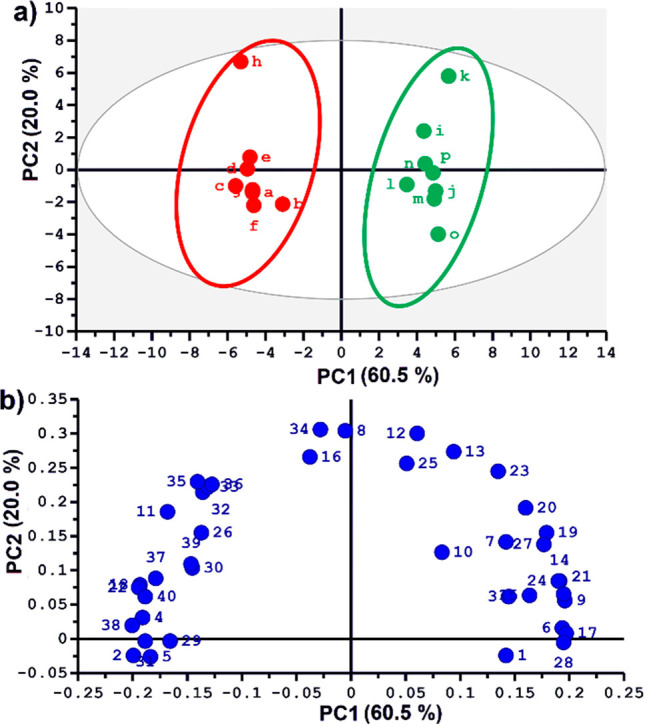
Figure 2.

(a) Scores plot and (b) loadings plot of the principal component analysis (PCA) obtained from 40 spectral buckets from hyperpolarized 13C spectra of 16 tomato fruit extracts. Integrals were normalized to Na-TSP-d4 as an internal reference and to the weight of the sample used for extraction. Mean centering and unit variance scaling were used in PCA. Correspondence of bucket numbers to spectral regions is given in Figure S3.
