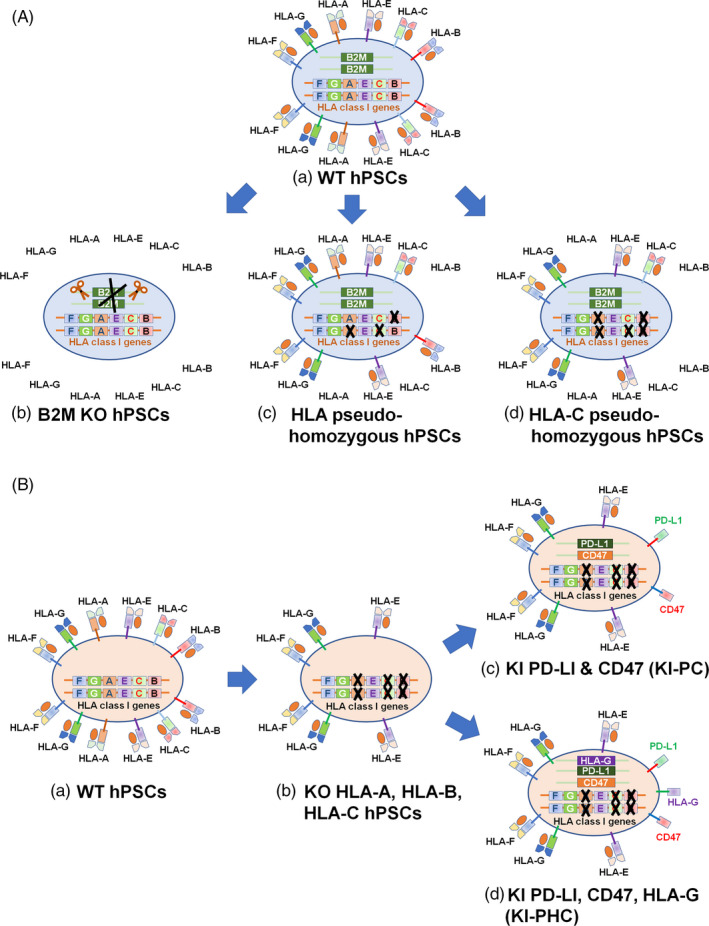
Figure 3.

Schematic illustration of HLA pseudo‐homozygous hPSCs and hypoimmunogenic hPSCs generation. A, HLA pseudo‐homozygous hPSC generation. (a) WT hPSCs. (b) B2M‐knocked out hPSCs. (c) HLA pseudo‐homozygous hPSCs by knocking out single alles of HLA‐A, HLA‐B and HLA‐C. (d) HLA pseudo‐homozygous hPSCs by knocking out HLA‐A and hLA‐B as well as single alles of HLA‐C where single HLA‐C alle was remained. B, Hypoimmunogenic hPSCs. (a) WT hPSCs. (b) hPSCs knocked out HLA‐A, HLA‐B and HLA‐C. (c) hPSCs knocked out HLA‐A, HLA‐B and HLA‐C where PD‐L1 and CD47 genes were knocked in. (d) hPSCs knocked out HLA‐A, HLA‐B and HLA‐C where PD‐L1, CD47 and HLA‐G genes were knocked in
