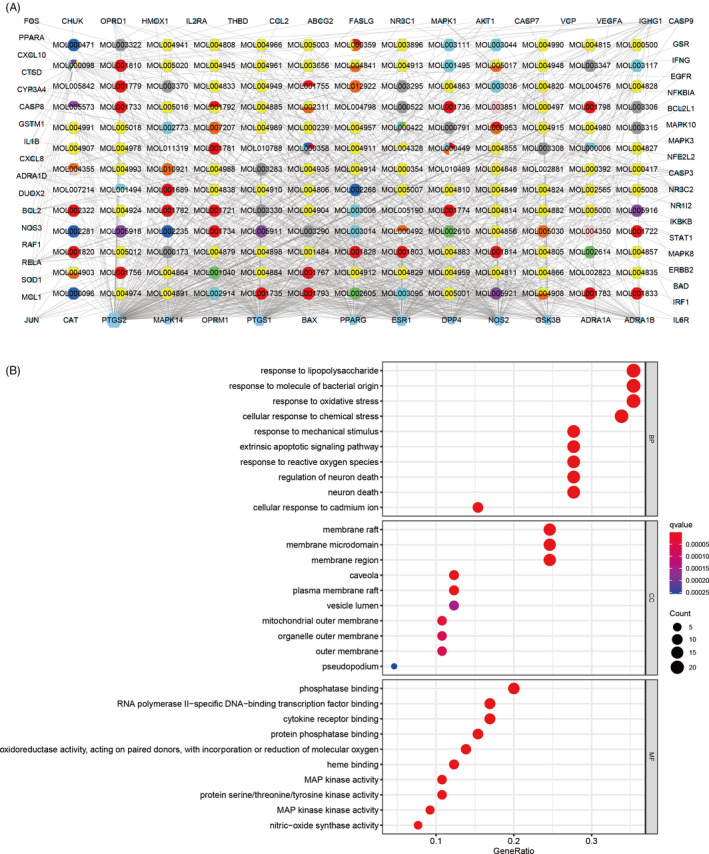
Figure 2.

Construction of the drug‐target pharmacology network and GO enrichment analysis. A, The drug‐targets interaction pharmacology network. Circles represent the small molecule active compounds in LQC. Each colour represents a traditional Chinese medicine ingredient. Hexagon represents the COVID‐19–related target genes, and edges represent the interaction between the small molecule compounds and the target genes. B, GO enrichment analysis of the target genes. Gene ratio refers to the ratio of enriched genes to all target genes, and counts refer to the number of the enriched genes
