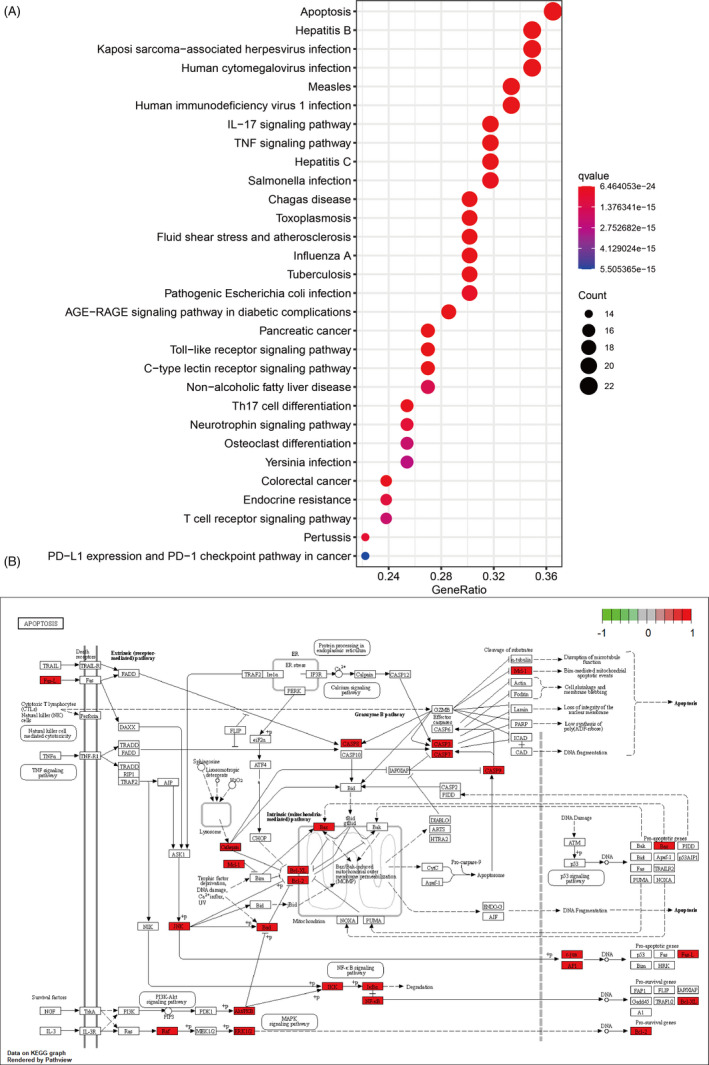
Figure 3.

KEGG enrichment analysis and pathway map. A, KEGG enrichment analysis of the target enes. Gene ratio refers to the ratio of enriched genes to all target genes. Counts refer to the number of the enriched genes. B, Pathway map of apoptosis as the most significant enriched pathway
