Figure 1.

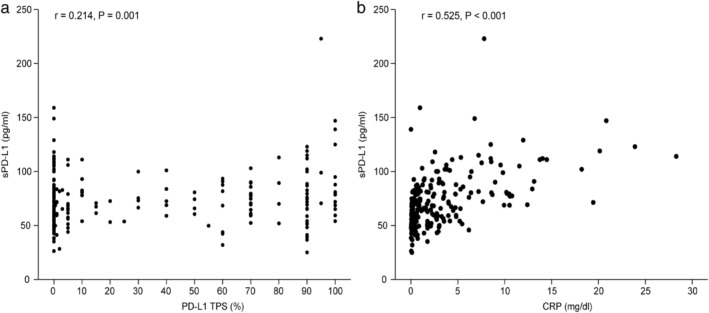
Linear regression analysis of serum soluble PD‐L1 (sPD‐L1) level and (a) PD‐L1 tumor proportion score (TPS) on tumor cells and (b) serum CRP.

Linear regression analysis of serum soluble PD‐L1 (sPD‐L1) level and (a) PD‐L1 tumor proportion score (TPS) on tumor cells and (b) serum CRP.