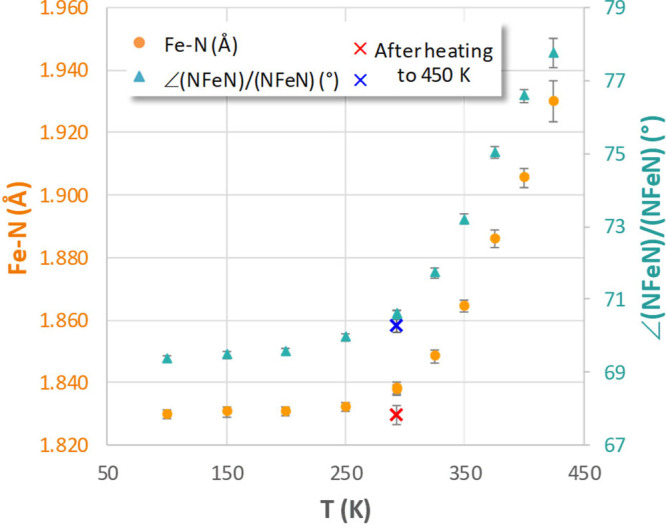
Figure 2.

Average Fe–N bond lengths (orange circles) and dihedral angle between ligand coordination planes (blue triangles) as a function of temperature in a single crystal of compound 5. The crosses correspond to the structure after heating to 450 K and loss of the solvent molecule. Error bars show the estimated standard deviations obtained from the X-ray analysis.
