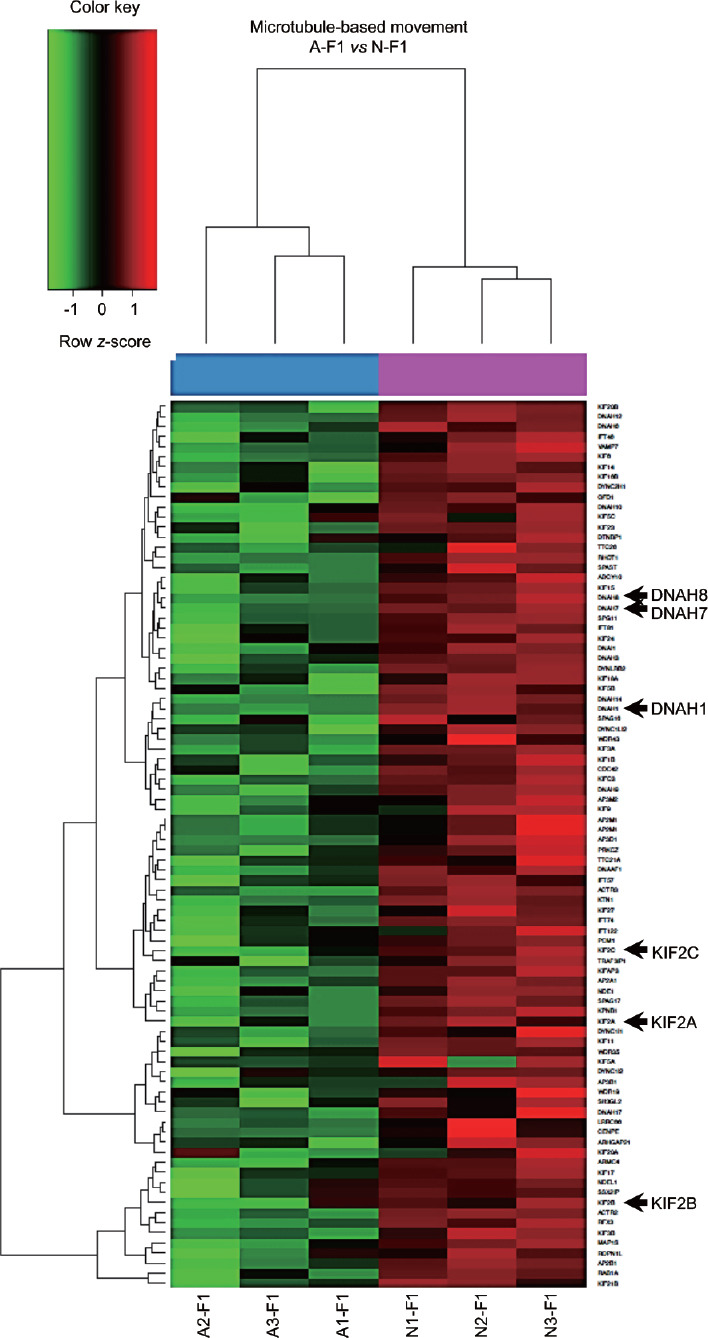
Figure 3.

Heatmap of the core enrichment of the biological process microtubule-based movement. Columns correspond to sperm samples analyzed, whereas lines represent genes within the core enrichment. Arrows indicate genes downregulated in A–F1 that were also identified in the leading-edge analysis of biological processes, cellular components, and molecular functions, as shown in Figure 2. Color indicates gene expression value intensities (z-score), where red signifies upregulation, green downregulation, and black unchanged. A–F1: asthenozoospermic sperm subpopulation with high motility; N–F1: normozoospermic sperm subpopulation with high motility.
