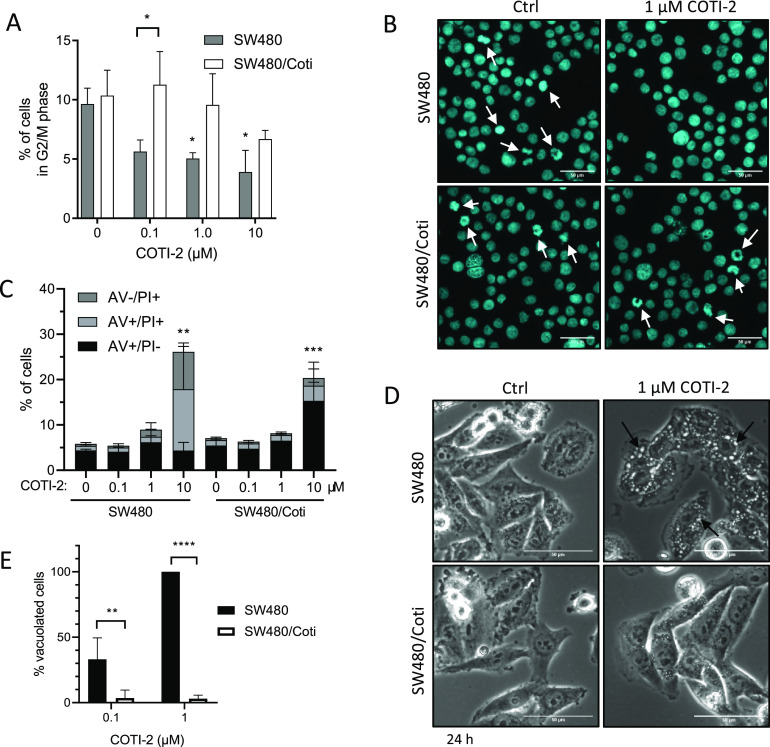
Figure 3.
Cell cycle arrest and cell death induction by COTI-2 in SW480 and SW480/Coti cells after 24 h treatment. (A) The percentage of cells in G2/M phase was analyzed by staining ethanol-fixed cells with propidium iodide (PI) followed by flow cytometry. Mean ± SD was derived from three independent experiments. (B) Nucleic morphology was analyzed by DAPI staining of methanol/acetone (1:1)-fixed cells. Mitotic cells are indicated with an arrow (scale bar: 50 μm). (C) Cell death induction was analyzed by AV and PI stain followed by flow cytometry. Mean ± SD was derived from three independent experiments. (D) Representative microscopy images of paraptotic vesicle formation (arrow) in SW480 and SW480/Coti cells after 24 h treatment with 1 μM COTI-2 (scale bar: 50 μm). (E) Percentage of vacuolated cells (counted in Image J). Mean ± SD was derived from three independent experiments. Significance between cell lines (asterix between bars) was calculated in (A) and (E) by two-way ANOVA and the Sidak’s multiple comparison test. Significant difference to the control group (indicated by the asterisk above bar) was calculated in (A) and (C) by one-way ANOVA and the Dunnett’s multiple comparison test (p < 0.05 *, p < 0.01 **, p < 0.001 ***, p < 0.0001 ****).

