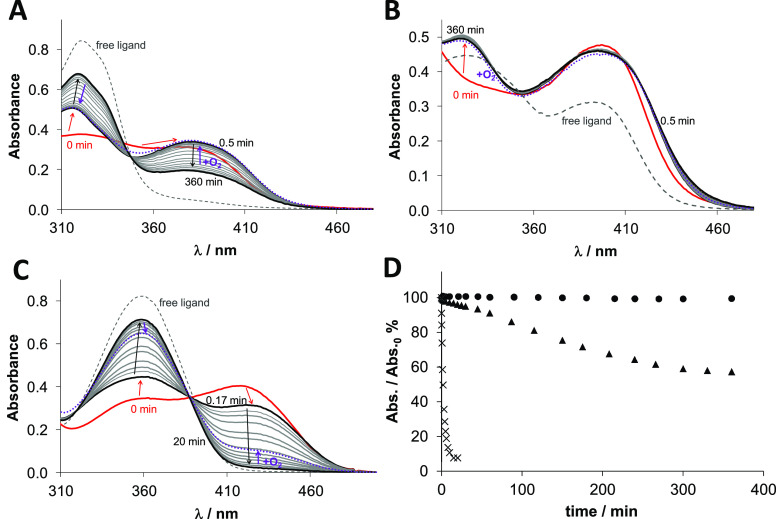
Figure 8.
Time-dependent changes of the UV–vis spectra of the (A) Cu-COTI-NH2, (B) Cu-COTI-2, and (C) Cu-Triapine complex (30 μM) in the presence of 300 equiv of GSH at pH 7.4 in aqueous solution under anaerobic conditions. (T = 25 °C; pH = 7.40 (50 mM HEPES)). Dashed lines represents the metal-free ligand and red lines the Cu-TSC complex without GSH. Red arrows indicate the change after the addition of GSH, black arrows after incubation with GSH for up to 360 min and violet arrows after oxygen exposure. (D) Time-dependent absorbance changes at the λmax of the S → Cu charge transfer band for the Cu-COTI-2 (circle solid), Cu-COTI-NH2 (triangle up solid), and Cu-Triapine complex (times) (30 μM) in the presence of 300 equiv of GSH at pH 7.4 in aqueous solution under anaerobic conditions (T = 25 °C; pH = 7.40 (50 mM HEPES)).

