Figure 1.
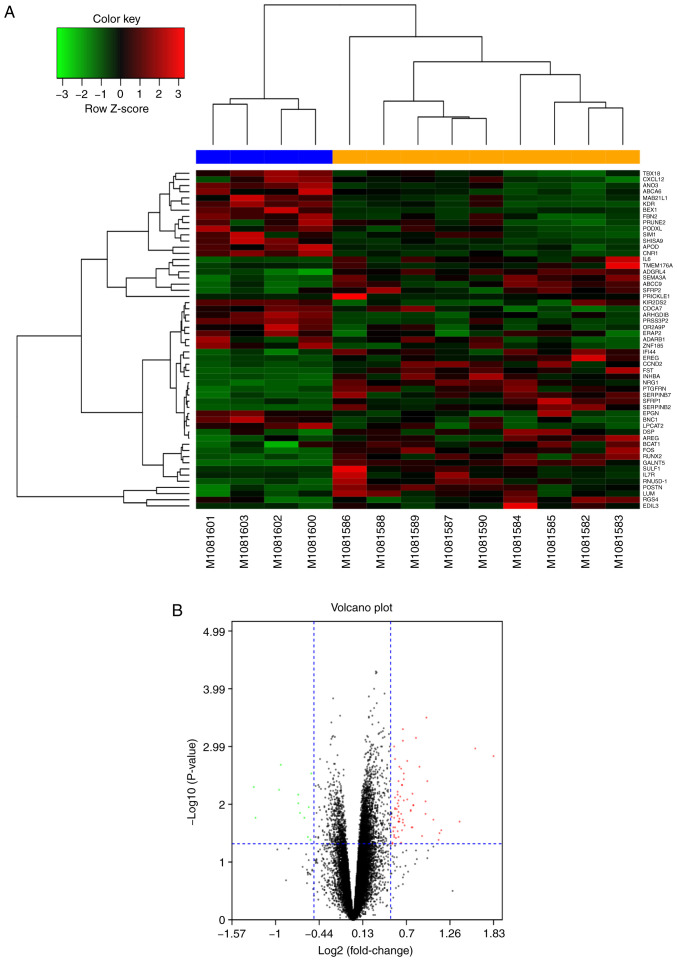
Heat and volcano map of DEGs. (A) Heat map of DEGs identified using a threshold of P<0.05. The color key represents fold change. (B) Volcano map of all DEGs. The red dots represent genes that are upregulated in keloids and the green dots represent downregulated genes. DEGs, differentially expressed genes.

