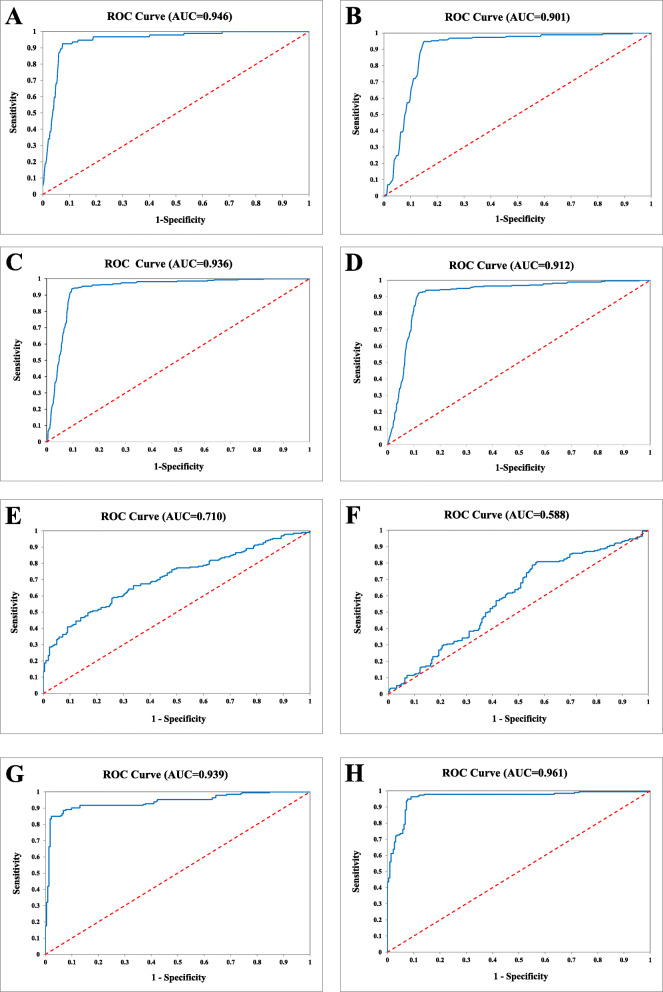
Fig. 2.
Receiver operating characteristic (ROC) curves for PCa diagnosis. ROC curve of the 25-Gene Panel urine test for PCa diagnosis in the retrospective training cohort (a), in the prospective validation cohort (b), and in the combination cohort (c); ROC curve of cross-validation of the 25-Gene Panel urine test for PCa diagnosis in the combination cohort (d); ROC curve of PSA (e), PSA at 4 ng/mL cutoff (f), the 25-Gene Panel urine test (g), and the 25-Gene Panel urine test and PSA combination (h) for PCa diagnosis in the cohort of 414 patients

