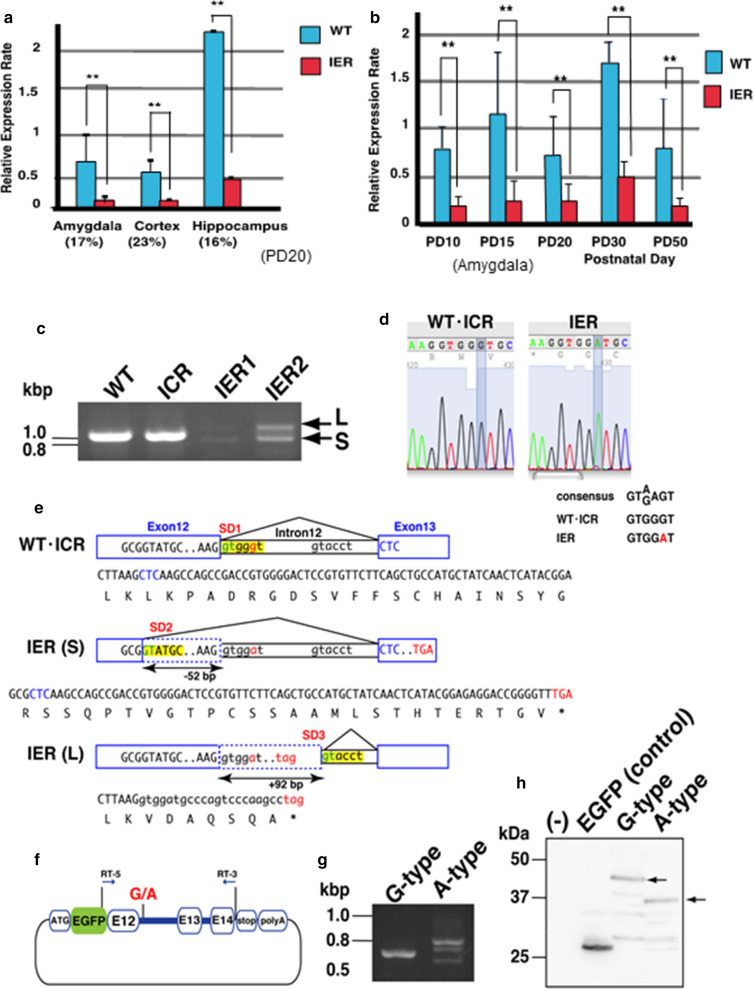
Fig. 2.
Abnormal splicing of Dscaml1 in IER. a Relative expression levels of the Dscaml1 transcripts in indicated brain regions of WT and IER at PD20 measured by quantitative RT-PCR analyses (n = 6 per genotype, **p < 0.01, Student’s t-test, Error bar: s.e.m.). b Temporal expression profiles of Dscaml1 transcripts in rat amygdala at indicated postnatal stages (n = 6 per genotype, **p < 0.01, Student’s t-test, Error bar: s.e.m.). c RT-PCR to amplify Dscam1 cDNA spanning from exons 9 to 14 of PD20 hippocampus of indicated genotypes. d One base change of IER genome with showing the alignments of the consensus sequences for the SD1 splicing donor site. e Schematic picture showing the abnormal splicing between exons 12 and 13 in IER. Asterisks indicate translational stop codons that appear in both shorter (S) and longer (L) transcripts. f Schematic for the G-and A-type expression vectors for in vitro splicing assay. g Expression of G- and A-type Dscaml1 in COS7 cells transfected with pEGFP-Dscaml1 (exon 12–14). h Immunoblot analysis with an anti-GFP antibody detected the EGFP-DSCAML1 fusion proteins. Arrows indicate signals at predicted sizes

