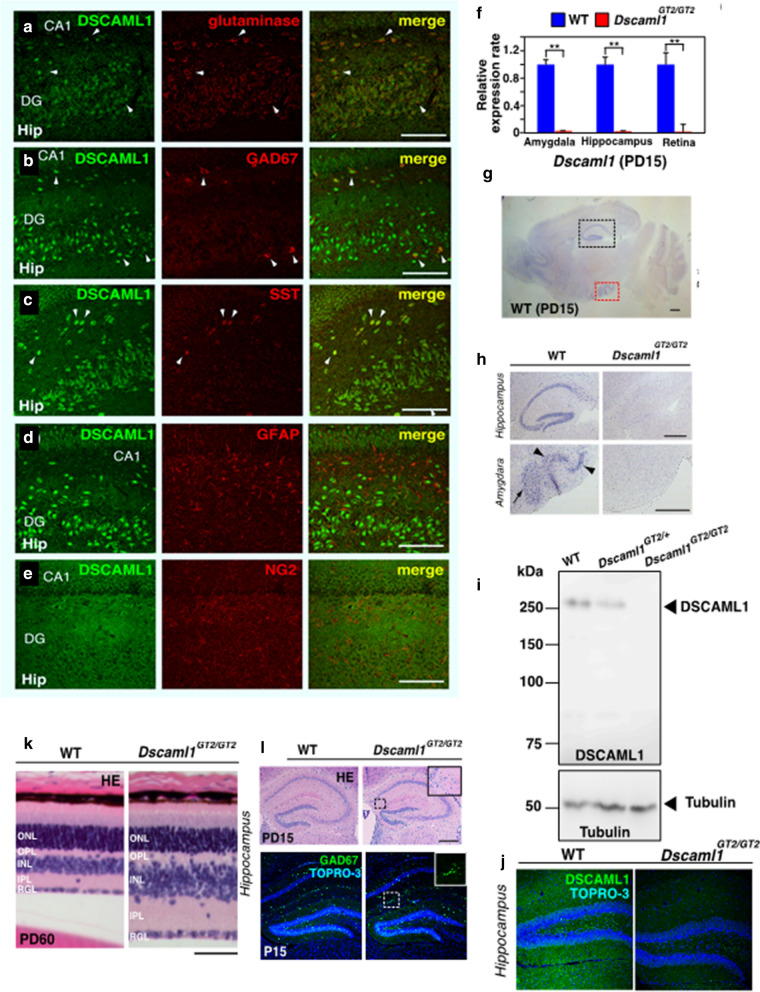
Fig. 3.
DSCAML1GT2/GT2 mice exhibit IER-like phenotypes. a–e Double immunostaining with DSCAML1 (green) and specific markers (red), such as glutaminase (a), GAD67 (b), SST (c), GFAP (d) and NG2 (e) to the rat hippocampus at PD20. Arrowheads indicate colocalization of DSCAML1 and markers. Scale bars: 100 µm. f Quantitative RT-PCR to Dscaml1 transcripts in indicated regions of Dscaml1GT2/GT2 mice at PD15 (n = 10 per genotype; Student’s t-test; **p < 0.01, Error bar: s.e.m). g In situ hybridization of sagittal sections of wild type mouse brains probed with Dscaml1 at PD15. Scale bar: 500 µm. h High magnified pictures of the areas of rectangles areas of g and pictures of the corresponding areas of Dscaml1GT2/GT2 mouse. Arrowheads and an arrow indicate Dscaml1 expression in the hippocampus and amygdala, respectively. Scale bars: 500 µm. i Immunoblot analyses of lysates from the PD15 hippocampus with anti-DSCAML1 and Tubulin antibodies. j Distribution of DSCAML1 protein in the mouse hippocampus at PD15. Nuclei were counterstained with TOPRO-3. k, l Retinal (PD60, k), and hippocampal (PD15, l) structures visualized with HE staining. Inset in l is magnified rectangles to display abnormal cell clustering in the hippocampus of Dscaml1GT2/GT2 mouse. Scale bars: 100 µm (k), 200 µm (l)

