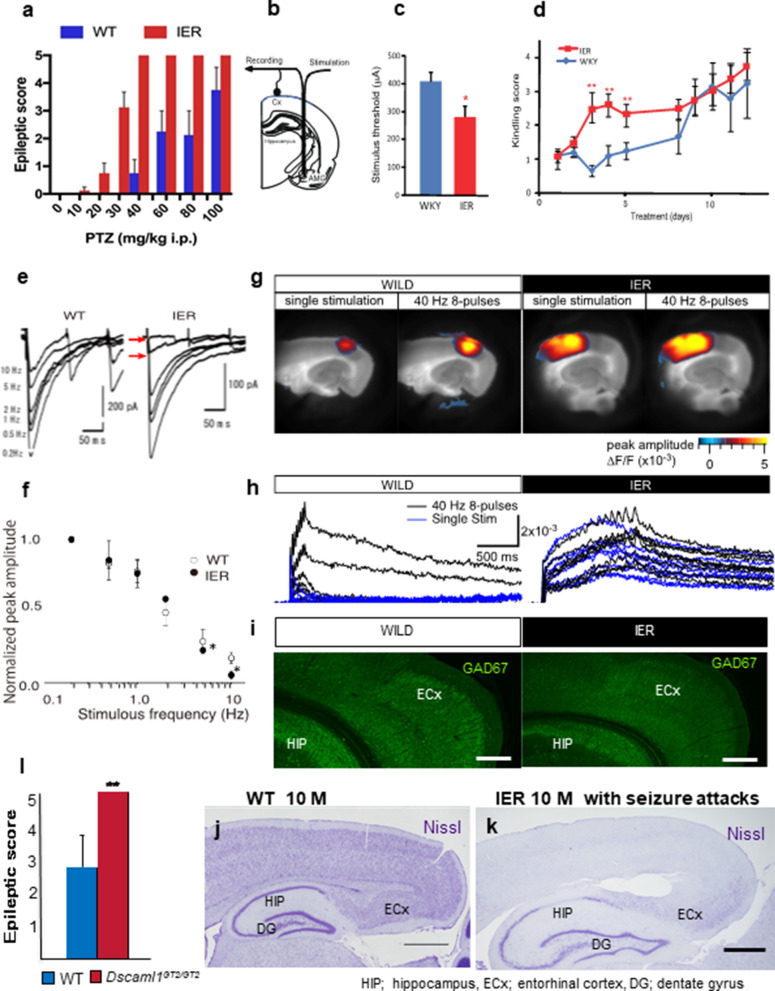
Fig. 4.
Epileptic susceptibility of the IER and sustained cortical activation evoked from the ECx of IER. a PTZ administration to wild type rats and IER at PD20 at indicated doses. The epileptic score based on Racine's score is indicated (n = 6 F6, 98 = 5.691, p < 0.001, 2-way ANOVA). b Schematics picture for electrical amygdala kindling. c Stimulus threshold for after-discharge at the amygdala on the first day (n = 8 per genotype, *p < 0.05, Student’s t-test, Error bars: s.e.m.). d Kindling score based on Racine's score at each day of the experiment (n = 8 per genotype, **p < 0.01, Student’s t-test, Error bars: s.e.m.). e Examples of IPSCs evoked at various stimulus frequencies (0.2–10 Hz) from pyramidal neurons in the basolateral amygdala of WT and IER. IPSCs showed further frequency-dependent suppression at 5–10 Hz in IER (red arrows). f The relationship between normalized IPSC peak amplitude and stimulus frequency. Frequency dependent IPSC impairment was prominent more than 5 Hz stimulations in IER. At the low frequency stimulation (0.2–2 Hz), IPSC is maintained in both WT and IER (n = 8 per genotype, *p < 0.05, Student’s t-test, Error bars: s.e.m.). g, h Representative cortical activation upon electrical stimulation with VSD-imaging in the indicated phenotypes (single or 40 Hz eight pulses); VSD amplitude maps (g) and time courses (h). i Distribution of inhibitory (GAD67-positive) neurons in the ECx of WT and IER. Scale bars: 500 µm. j, k Nissl staining of the ECx of WT (j) and IER (k) at 10 M. IERs were experienced frequent seizures. Scale bar: 1 mm. l PTZ administration to wild type mice and Dscaml1GT2/GT2 mice at 40 mg/kg. The epileptic score based on Racine's score is indicated (n = 4 per genotype; Student’s t-test; **p < 0.01, Error bar: s.e.m)

