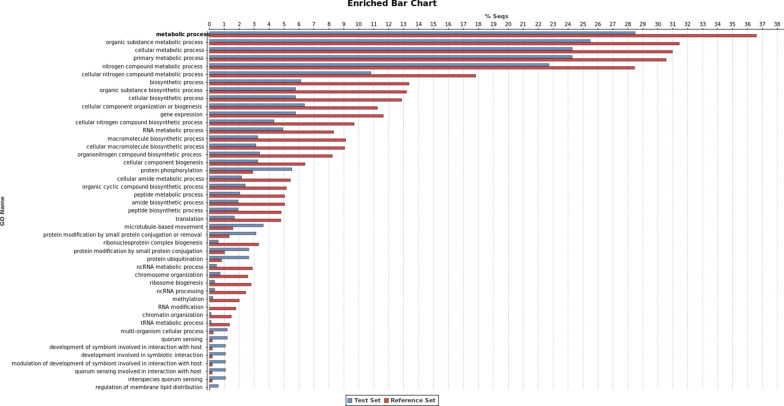
Fig. 2.
Gene Ontology enrichment analysis for the upregulated transcripts. The GO enrichment analysis (Fisher’s exact test) was performed using as test set the list of upregulated transcripts and as reference set the L. infantum JPCM5 predicted proteome. FDR < 0.05 was set as a threshold to define the functional enrichment significance. The percentage of sequences in each GO category is described in the Y axis. Red bars represent the percentage of sequences classified in each GO term for the “reference set” group, and the blue bars represent the percentage of sequences classified in each GO term for the “test set” group (DE genes)

