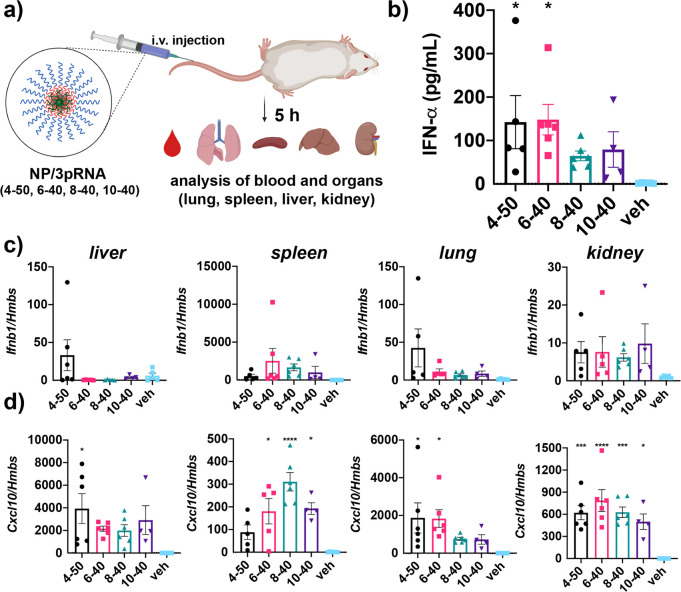
Figure 6.
In vivo evaluation of lead 3pRNA carriers. (a) Schematic of in vivo analysis of 3pRNA carrier activity in mice. Image created with BioRender.com. (b) Serum levels of IFN-α following intravenous administration of 3pRNA using indicated carrier. qRT-PCR analysis of (c) Ifnb1 and (d) Cxcl10 expression in liver, spleen, lungs, and kidney of mice following intravenous administration of 3pRNA using indicated carrier. Vehicle (veh) is PBS. All values plotted as mean ± SEM. *P < 0.05, **P < 0.01, ***P < 0.001, ****P < 0.0001 vs vehicle by one-way ANOVA with Dunnett’s multiple comparison test.

