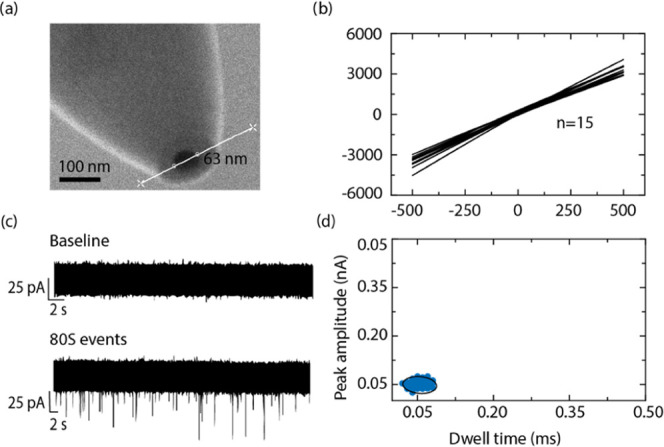
Figure 2.

(a) SEM micrograph of a nanopore at the tip of a nanopipette measuring approximately 63 nm in diameter. (b) IV characteristic of 15 nanopipettes fabricated using the same pulling parameters. (c) Representative ion current traces in the absence (top panel) and presence (bottom panel) of ribosomes, each downward spike, called events, represent an individual 80S ribosome translocating out of the nanopore. (d) Peak amplitude versus dwell time plot of 80S events of S2 cells indicating a tight cluster; the black line represents the 95% confidence ellipse.
