Figure 3.
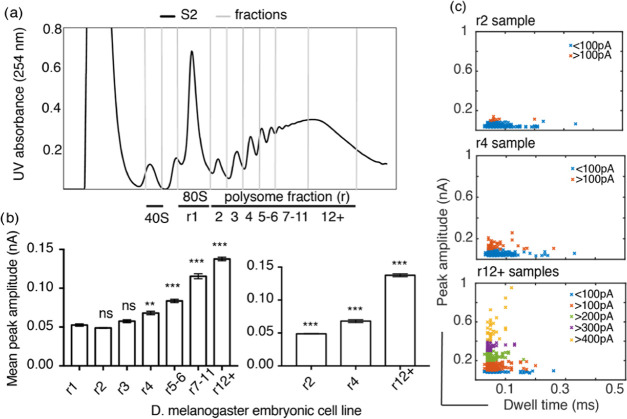
D. melanogaster S2 cell polysome analysis. (a) UV (254 nm) profile across sucrose gradient with ribosomal complexes separated based on their sedimentation profile. RNP (ribonucleoproteins and RNA) remain at the top of the gradient, followed by 40S subunits, 60S, 80S, and polysomes with various numbers of ribosomes bound per mRNA. Up to 11 ribosomes per mRNA can been seen in this example; fractions were taken as indicated r1, r2, r3, r4, r5–6, r7–11, and r12+. (b) Statistical Kruskal–Wallis test for each of the polysome samples against 80S shows that there is no significant difference (ns) in the peak amplitude for r2 and r3, whereas there is a significant difference with a p-value of 0.03 (**) for r4 and p < 0.001 for r5–6, r7–11, and r12+ indicated by ***. Similar tests performed for r2, r4, and r12+ show that there is a significant difference between these three polysome samples, with p < 0.001 indicated by ***. The error bars indicate standard error of the mean of each sample. (c) Peak amplitude plotted against dwell time for at least 100 individual events for each sample; the events are color coded to represent every 100 pA peak amplitude increase.

