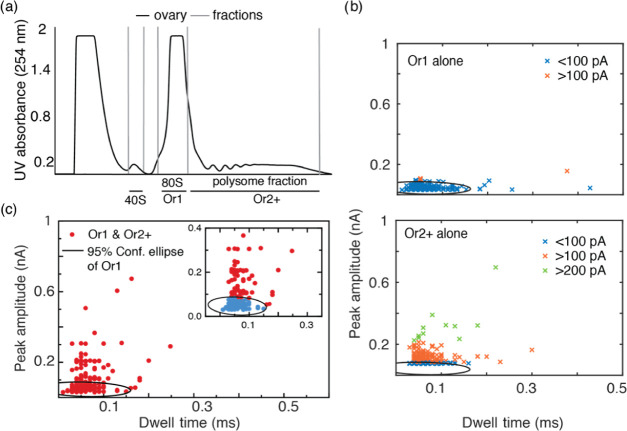
Figure 4.
(a) Sucrose gradient fractions of lysates purified from D. melanogaster ovaries separated into 40S, 80S (Or1), and polysomes (Or2+). (b) Scatter plots for individual 80S and polysome samples obtained from D. melanogaster ovaries, indicating the clear difference in ion current peak characteristics between the two samples. The black circle indicates the 95% confidence ellipse fitted for 80S data and superimposed onto the polysome data. (c) Peak amplitude plotted against dwell time for 80S and polysome mixture, the zoomed in inset indicates the events that fall within the 95% confidence ellipse represented in blue.

