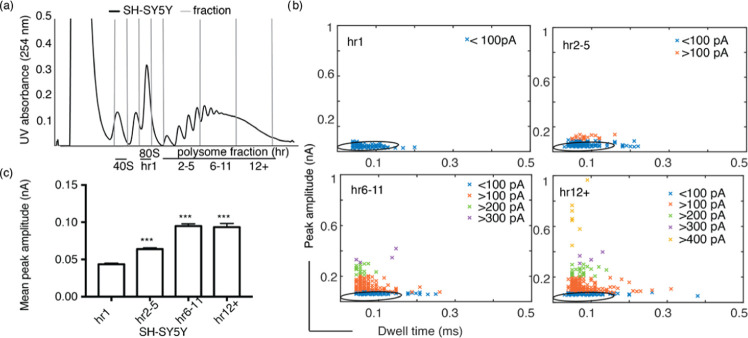
Figure 5.
(a) Sucrose gradient UV trace for human neuronal cell line sample (SH-SY5Y), fractioned into 40S, 80S (hr1) and polysomes hr2–5, hr6–11, and hr12+ with 2–5, 6–11, and ∼>11 ribosomes, respectively. (b) Scatter plots of 80S and polysomes; the graphs show a similar trend of peak amplitude increase with respect to an increase in the number of ribosomes. The hr1 data is fitted with a 95% confidence ellipse, which is then superimposed onto the polysome data. (c) Mean peak amplitude data of SH-SY5Y polysomes compared with 80S samples exhibit a significant difference of p < 0.001 represented by ***. Kruskal–Wallis test was performed for this data, and the error bars indicate standard error of the mean.

