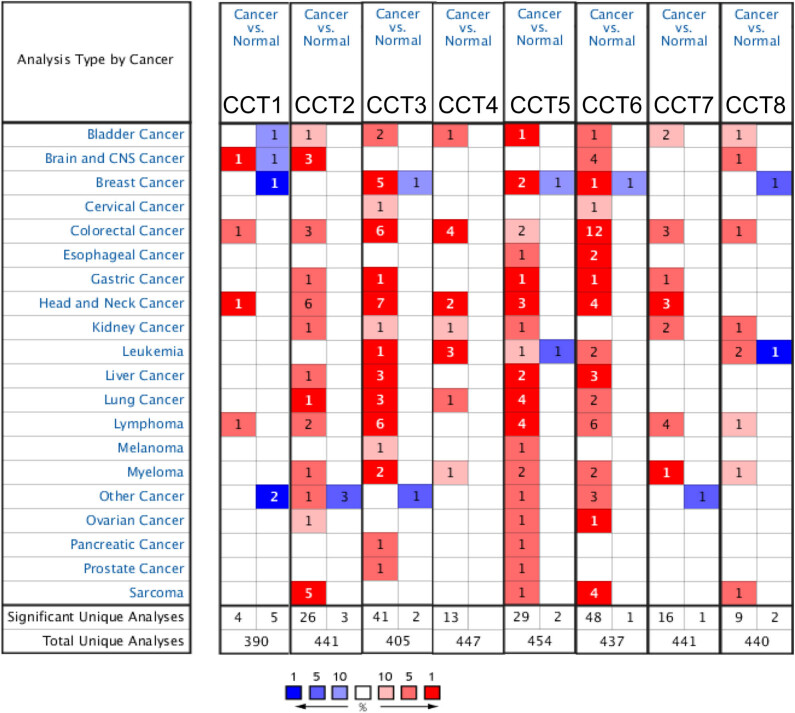
Figure 1.
The mRNA transcriptional levels of CCTs in different types of cancers (ONCOMINE). This graphic was generated from ONCOMINE, indicating the numbers of datasets with statistically significant (P < 0.0001) mRNA overexpression (red) or downexpression (blue) of CCTs (different types of cancers vs corresponding normal tissue). Cell color was determined by the best gene rank percentile for the analyses within the cell, and the gene rank was analyzed by the percentile of target gene in the top of all genes measured in each research.

