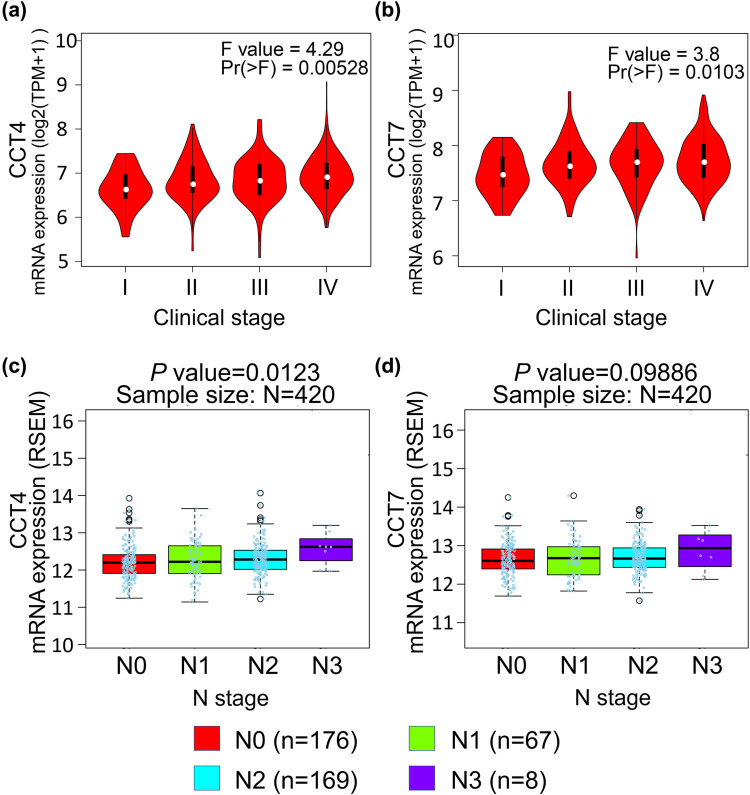
Figure 3.
Correlation between the CCT4/7 expression and tumor stage in HNSC patients (GEPIA and LinkedOmics). (a and b) Violin plots showing the relative expression of CCT4/7 in HNSC patients in stage I, II, III, or IV. (c and d) Boxplots indicating the relative expression of CCT4/7 in HNSC patients with N stage of 0, 1, 2, or 3.

