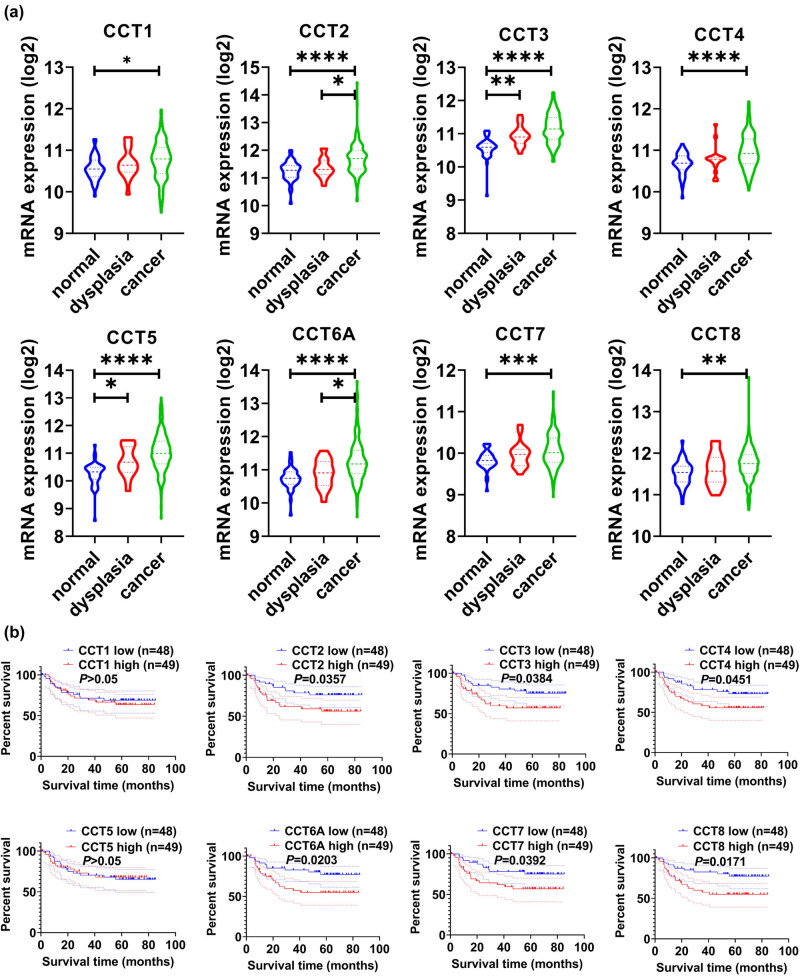
Figure 5.
Validation of CCTs’ differential expression and prognostic values using GEO datasets. (a) Validation of CCTs expression level in GSE30784. The expression status of eight CCTs was positively correlated with the disease status. *P < 0.05; **P < 0.01; ***P < 0.001; ****P < 0.0001. (b) Validation of CCTs’ prognostic value in GSE41613. High CCTs expression groups had significantly lower OS than low CCTs expression groups. Shown is the log-rank P value.

