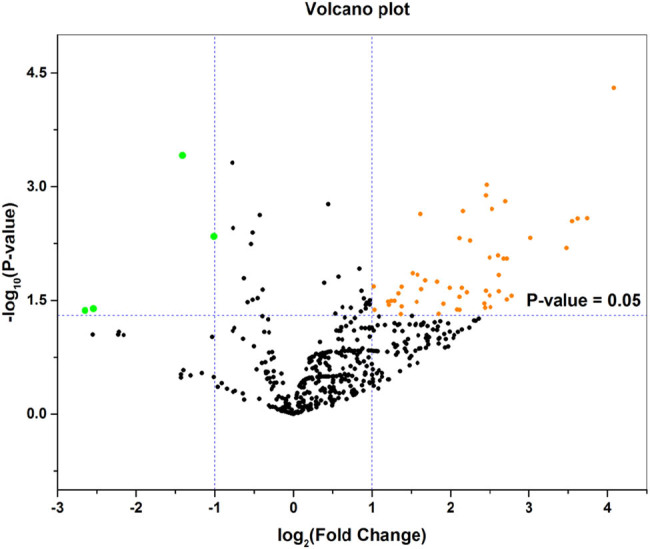
Figure 3.

Volcano plot of the DE-miRNAs. The black points represent genes with no significant difference. The orange points represent upregulated genes screened based on the |log FC| > 1.0 and P-value <0.05. The green points represent downregulated genes screened based on the |log FC| > 1.0 and P-value <0.05.
