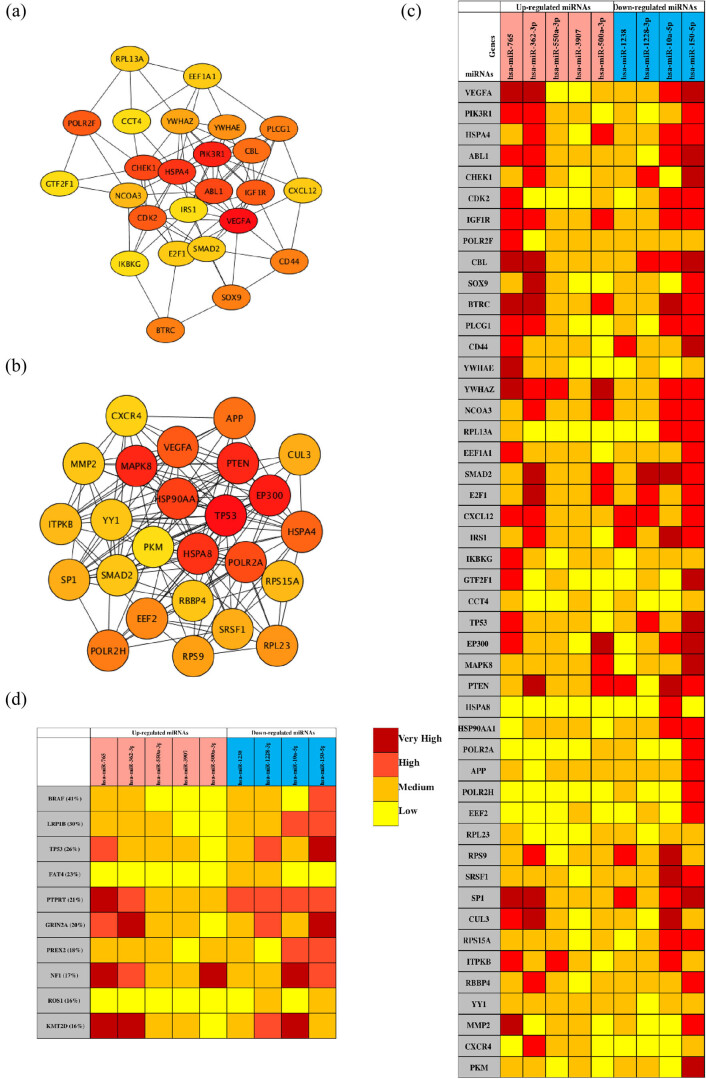
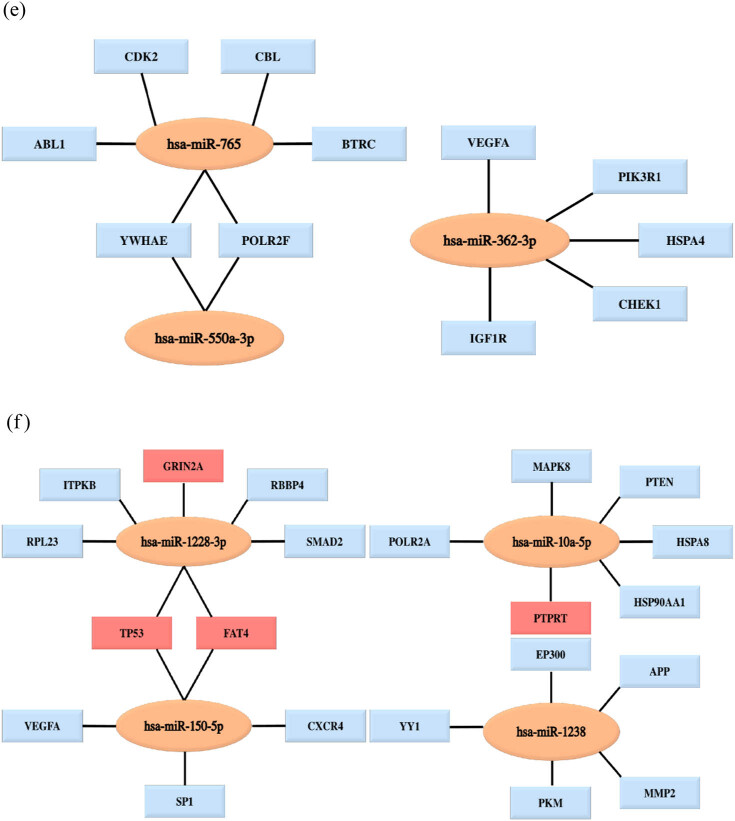
Figure 5.
Analysis of the PPI network and the miRNA target network. (a) The mapped networks for the top 25 hub genes for upregulated miRNAs. (b) The mapped networks for the top 25 hub genes for downregulated miRNAs. (c) The mirDIP analysis of interaction levels between hub genes and DE-miRNAs. (d) The mirDIP analysis of interaction levels between the main mutated genes and DE-miRNAs. (e) The mapped networks for upregulated miRNAs and hub genes. (f) The mapped networks for downregulated miRNAs and hub genes. The red gene indicates that it is both a mutant gene and a core gene.


