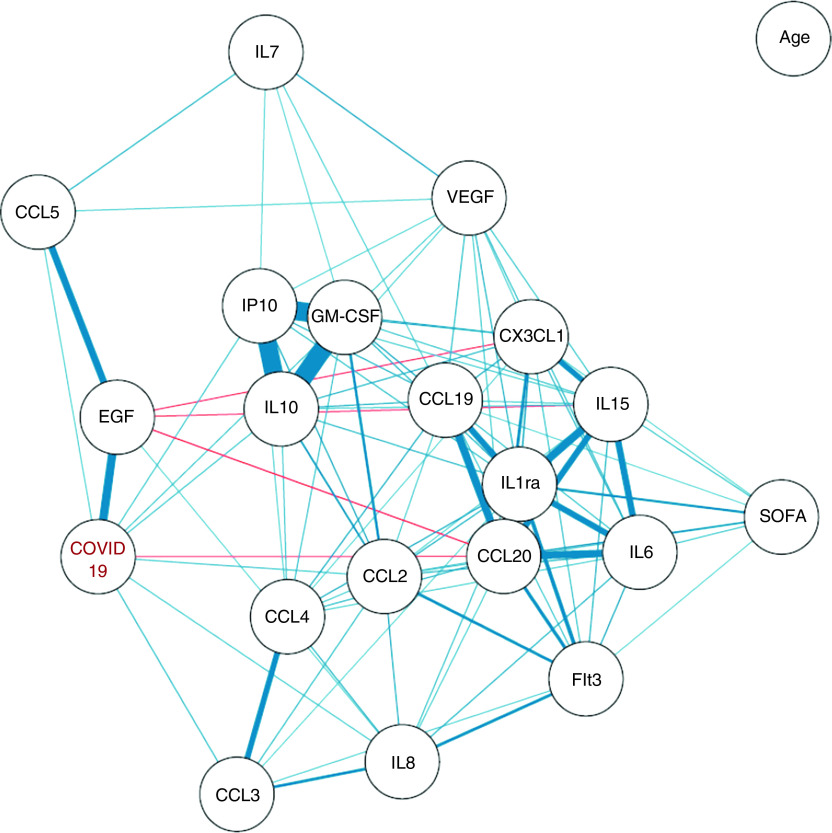
Figure 3.
Correlation network between cytokines and coronavirus disease (COVID-19) status. The correlation network is constructed from all pairwise correlations between cytokines and the COVID-19 status, computing Spearman and biserial correlation coefficients for continuous–continuous and binary–continuous variables correlations, respectively. Variables are represented by nodes and connected by edges. Red and blue lines represent negative and positive correlations, respectively, with line width, color saturation, and variable proximity on the graph being proportional to the strength of the correlation. Shown edges are all based on statistically significant correlation coefficients at the P < 0.05 level after Benjamini-Hochberg correction for test multiplicity. SOFA = Sequential Organ Failure Assessment.

