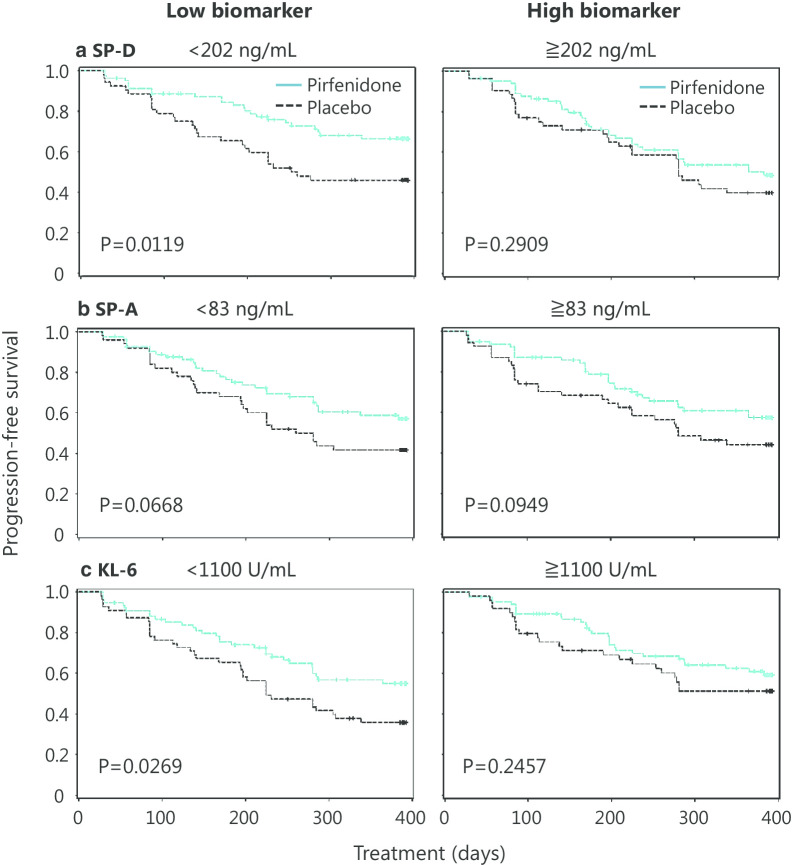
Fig. 3.
Relationship between serum concentrations of biomarkers at baseline and the efficacy of pirfenidone on progression-free survival. All patients were dichotomized by the median concentration of a SP-D, b SP-A and c KL-6 at baseline to the high and low biomarker subgroups. Blue lines, pirfenidone; black lines, placebo. The disease progression was defined by a > 10% relative decline in vital capacity from baseline and/or death. Progression-free survival was estimated using the Kaplan–Meier method and compared using the log-rank test

