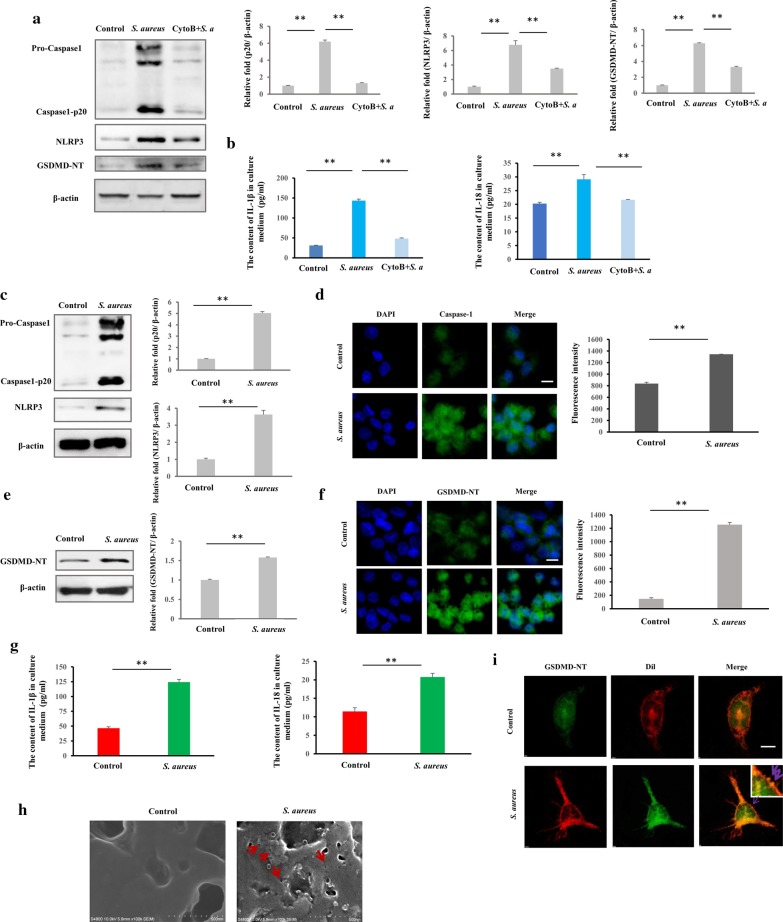
Fig. 2.
Staphylococcus aureus triggers pyroptosis in human macrophages. Cells were infected with S. aureus for 3 h (MOI 25:1), and the pyroptotic characteristics were examined, including pyroptosic protein markers, inflammatory cytokines release, and morphology. a Expression of pyroptosis-related proteins in response to S. aureus invasion and Cytochalasin B was assessed by western blot. NLRP3, caspase1-p20 and GSDMD-NT proteins were less prominent than S. aureus invasion after Cytochalasin B treated. b The levels of IL-18 and IL-1β were quantified by an ELISA. The levels of IL-18 and IL-1β were less prominent than S. aureus invasion after Cytochalasin B treated. c Western blot analysis showed S. aureus enhanced NLRP3 and caspase1-p20 expression in infected macrophages. d Immunofluorescence assay showed greater caspase 1 expression in infected macrophages than in the control. Representative confocal microscopy images of caspase 1 expression (Green) in cells that were co-stained with DAPI (blue). Scale bars represent 10 μm. e GSDMD-NT expression was examined in S. aureus-infected macrophages and controls by western blot. S. aureus invasion induced greater GSDMD-NT expression in infected macrophages. f Immunofluorescence assay showed greater GSDMD-NT expression in infected macrophages than in the control. Representative confocal microscopy images of GSDMD-NT expression (green) in cells that were co-stained with DAPI (blue). Scale bars represent 10 μm. g IL-18 and IL-1β levels were determined by ELISA. S. aureus invasion induced more release of IL-18 and IL-1β in infected macrophages. h Scanning electron microscopy of GSDMD-NT pores on plasma membrane in S. aureus-infected macrophages. Red arrow indicates GSDMD-NT pore. Scale bar, 500 nm. i GSDMD-NT (green) in cells co-stained with Dil (red) as a membrane marker. Representative confocal microscopy images of S. aureus-infected macrophages and control cells by immunofluorescence assay. The purple arrows indicate the necks of budding vesicles, indicating shedding of wounded plasma membrane in S. aureus-infected macrophages. Scale bars represent 1 μm. The resolved bands were quantified using Gel-Pro Analyzer 4.0 (Media Cybernetics, Inc., Rockville, MD, USA). Fluorescence intensity of the immunofluorescent was measured by imaging analysis software (NIS-Elements Viewer, Nikon Instruments Inc. Shanghai, China). *p < 0.05; **p < 0.01. n = 3 independent experiments. Error bar indicates SD

