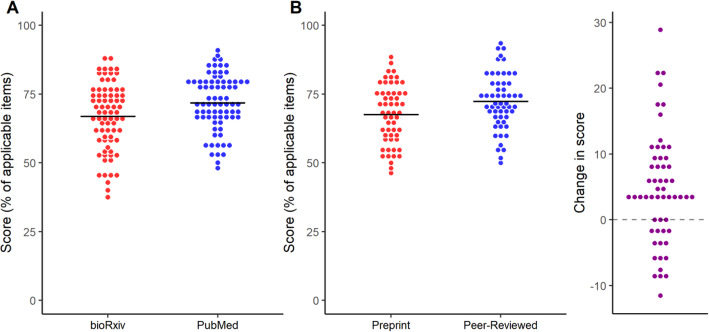
Fig. 2.
Reporting scores by source of the article. a Random samples of bioRxiv and PubMed were evaluated. Mean ± S.D.: bioRxiv = 66.9 ± 12.2, PubMed = 71.9 ± 10.1; n = 76/group. Student’s t-test, t = 2.75, p = 0.007, 95% C.I. [1.40, 8.59]. b A sample of bioRxiv articles was compared against their peer-reviewed versions published by a journal. Mean ± S.D.: Preprint = 67.6 ± 10.8, Peer-Reviewed = 72.3 ± 10.1; n = 56 pairs. Paired t-test, t = 4.15, p = 0.0001, 95% C.I. [2.44, 6.99]. On the right, absolute changes in score from preprint to peer-reviewed versions are plotted for each pair

