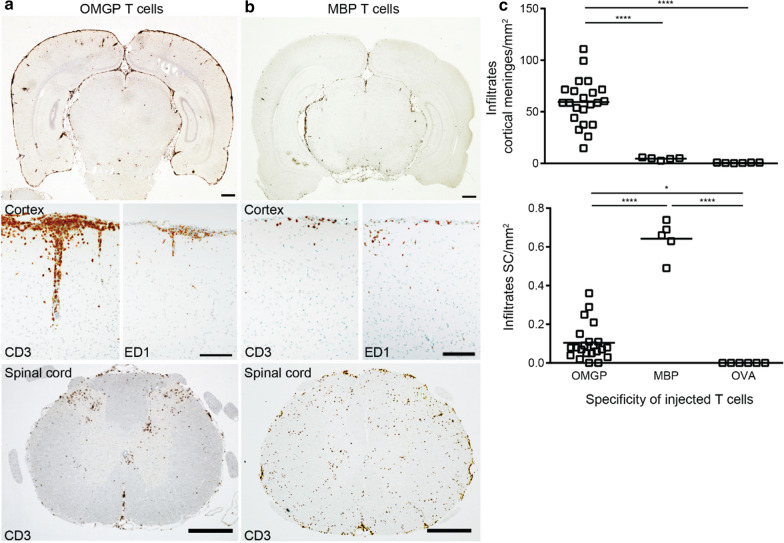
Fig. 5.
OMGP-specific T cells mediate cortical meningitis. Lewis rats were intravenously injected with OMGP-specific T cells (a) or MBP-specific T cells (b) and sacrificed after 5 days. Tissue sections were stained with mAbs to CD3 (T cells) or ED1 (macrophages), developed with DAB as substrate resulting in a brown color. Nuclei were counterstained blue. a OMGP-specific T cells mediate a cortical meningitis (images display representative histology seen with OMGP-specific T cells). Also an infiltration of the spinal cord is seen, preferentially in the dorsal horn (image from an animal with a high number of infiltrates in the spinal cord was selected to show the preferential localization of the infiltrates in the dorsal horn). b After transfer of MBP-specific T cells, lower number of CD3+ T cells in the cortex and few ED1+ macrophages are found in the cortical meninges. In contrast, a prominent infiltration of the spinal cord is seen. a, b Scale bars in the upper row represent 1 mm, in the middle row 0.1 mm and in the lower row 0.5 mm. c Quantification of the infiltrates by hematoxylin/eosin staining. The values are given as infiltrates per mm2. Cortical meninges: each dot represents the mean of the infiltrates of one animal, where 6 microscopic fields were counted. Spinal cord (SC) quantification: each dot represents the counted average of 20 SC cross sections. The 22 animals injected with OMGP-specific T cells include animals without an additional injected antibody, with control Abs and with OMGP Abs (data were pooled, because these three subgroups with OMGP-specific T cells were similar Fig. S7A). Tukey’s honest significance test is performed (p < 0.0001 ****, p < 0.05 *)

