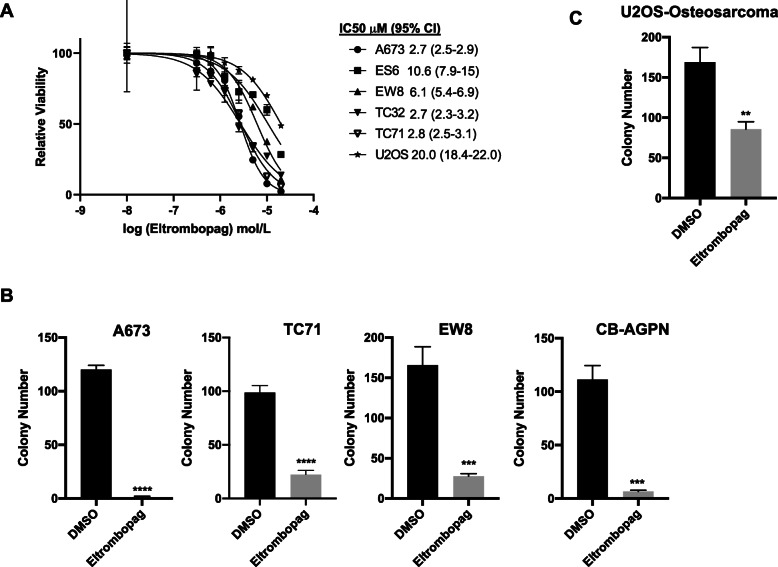
Fig. 2.
Eltrombopag inhibits Ewing sarcoma growth in vitro. a Dose response curves for Ewing sarcoma and osteosarcoma (U2OS) cell lines treated with different concentrations of eltrombopag. Cell viability was assessed 72 h after drug was added using the AlamarBlue assay. Error bars represent the mean ± SD of three technical replicates. b-c Colony formation assay for (b) Ewing sarcoma and (c) osteosarcoma cell lines treated with eltrombopag 5 μM for 14 days. Error bars represent the mean ± SD of three technical replicates. ** indicates P < 0.01, *** indicates P < 0.001, **** indicates P < 0.0001

