Fig. 4.
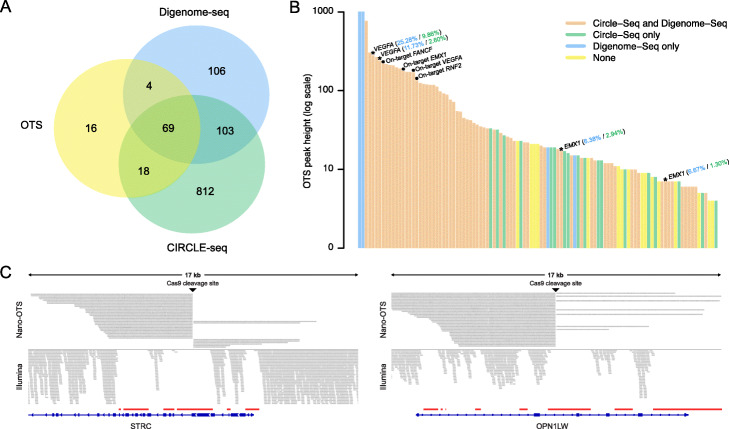
Comparison of OTS to other in vitro-based methods. a Venn diagram showing the overlap in results between OTS, Digenome-seq, and CIRCLE-seq for the four gRNAs EMX1, FANCF, RNF2, and VEGFA. OTS identified a total 107 sites for the four gRNAs. All 107 sites were detected by Nano-OTS and a subset (n = 26) of these were found also by SMRT-OTS. In previous in vitro experiments using the same four gRNAs, CIRCLE-seq and Digenome-seq identified 1002 and 282 binding sites, respectively. b Barplot showing the combined SMRT-OTS and Nano-OTS signals for the 107 sites detected by the off-target sequencing methods. The signals are shown on a log10 scale and the bars have been sorted in descending order. Bars are colored to indicate Cas9 cleavage sites detected by Digenome-seq (blue), CIRCLE-seq (green), or by both methods (orange). Yellow bars correspond to sites not detected by Digenome-seq or CIRCLE-seq. On-target sites for EMX1, FANCF, RNF2, and VEGFA have been marked by solid black circles. The asterisks mark off-target sites for EMX1 and VEGFA where editing was detected in cells in two previous CRISPR-Cas9 experiments: the Digenome-seq study [25] and the CIRCLE-seq study [28]. The blue and green numbers correspond to the fraction of edited molecules from the Digenome-seq and CIRCLE-seq study, respectively. c Two examples of “dark” genomic regions, STRC and OPN1LW, where Nano-OTS successfully identified an on-target site while short-read data failed to uniquely align. The Nano-OTS reads are displayed at the top and at the bottom is data from one individual from the SweGen dataset [39], sequenced to 30x coverage using Illumina paired-end 150 bp reads. The red lines mark the coordinates for dark genomic regions reported from the study by Ebbert et al. [32]

