
FIG. 4.
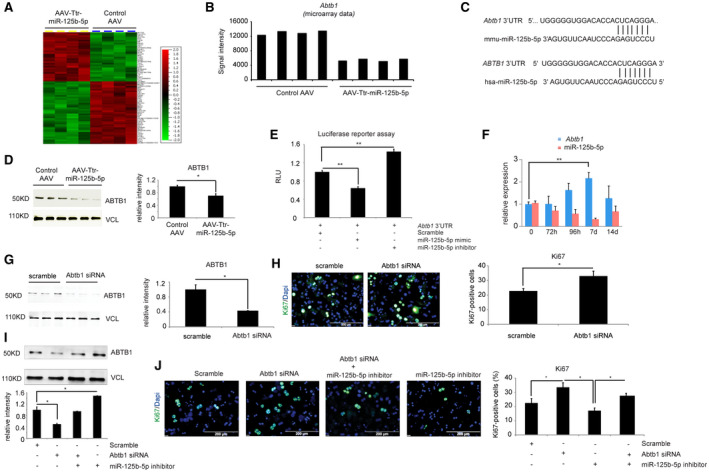
miR‐125b‐5p regulates Abtb1 expression in vivo. (A) The heat map shows differentially up‐ or down‐regulated genes (above 2‐fold change) obtained from microarray‐based mRNA expression analysis. (B) Microarray‐based mRNA expression analysis indicated that ABTB1 expression was down‐regulated in liver of mice injected with AAV8‐Ttr‐miR‐125b‐5p. (C) TargetScan‐based in silico analyses predicts Abtb1 as a target of miR‐125b‐5p in mouse and human. (D) Western blot analysis of ABTB1 in mice livers at day 5 after 2/3 PH. Vinculin was used as a loading control. (E) Luciferase reporter assay confirms the binding of miR‐125b‐5p with 3′ UTR of Abtb1. Primary hepatocytes transfected with miR‐125b‐5p mimic have lower RLUs, while hepatocytes transfected with miR‐125b‐5p inhibitor showed higher RLUs than the control miRNA scramble transfection. (F) qRT‐PCR analysis of ABTB1 expression and miR‐125b‐5p at the indicated time points during the termination phase, indicating an inverse correlation between the expression of ABTB1 and miR‐125b‐5p. (G) Determination of knockdown efficiency by western blot of primary mouse hepatocytes transfected with siABTB1 or scramble control. Vinculin was used as a loading control. Experiments were done in triplicates. Quantification of western blots is shown in the right panel. (H) Representative photographs and quantification of Ki67‐immunostained primary hepatocytes transfected with Abtb1 siRNA or scramble control. Quantification is shown in the right panel. (I) Western blot for ABTB1 and vinculin in primary mouse hepatocytes transfected with Abtb1 siRNA or miR‐125b‐5p inhibitor alone and together. (J) Ki67 immunofluorescence of primary mouse hepatocytes transfected with either Abtb1 siRNA or miR‐125b‐5p inhibitor alone and together. Scale bars, 200 μm. *P < 0.05, **P < 0.01; data are presented as mean ± SEM (n = 4 per group). Abbreviations: d, days; h, hours; hsa, human serum albumin; mmu, Mus musculus (house mouse); RLU, relative luciferase unit.