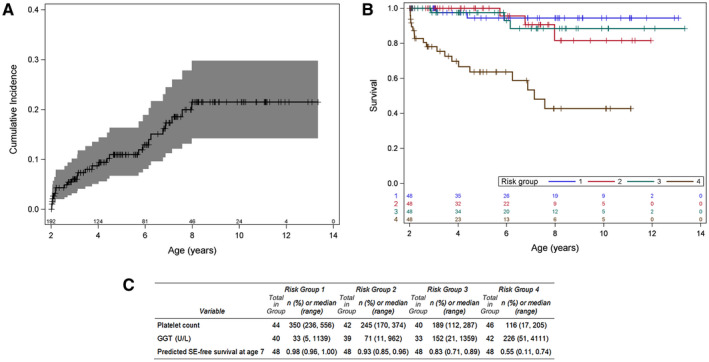
FIG. 3.

Incidence and risk for the SE model. (A) Cumulative incidence of SE among 192 study participants. (B) Kaplan‐Meier curves for SE‐free survival stratified by quartile of risk score. Stratification of participants shows a high‐risk group (group 4; brown) for the development of an SE. (C) Risk factor distribution of participants in the analysis by quartiles of risk is provided.
