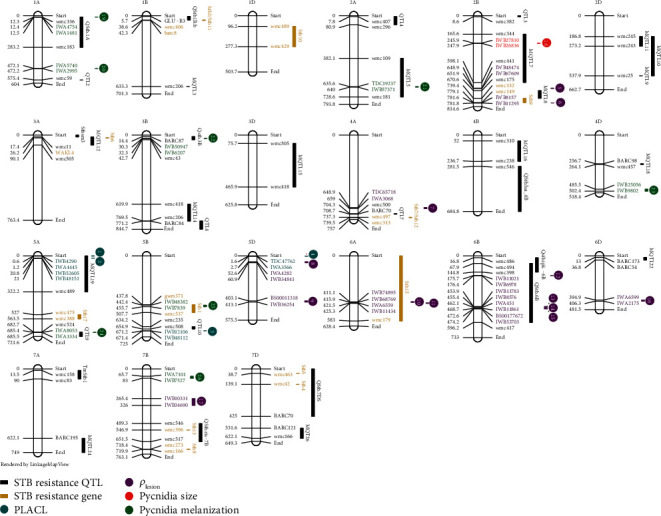
Figure 3.

Positions on the Chinese Spring reference genome (IWGSC 2018) of 26 significant GWAS marker-trait associations across four resistance traits compared to positions of previously mapped STB resistance genes [18]. The 26 associations are shown as numbered circles and a bar (95% confidence interval) in cyan for PLACL, purple for ρlesion, red for pycnidia size, and green for melanization. Confidence intervals of previously mapped STB resistance loci are shown in yellow bars (STB resistance genes) and black bars (STB resistance QTLs). SNP markers are presented as locus names from GrainGenes (https://wheat.pw.usda.gov/GG3/) for brevity. Markers with the prefix Tdurum_contig were abbreviated to TDC. Only SNP markers with significant associations with STB genes, QTLs, or the four phenotypes included in the GWAS are shown. For each association confidence interval, the first and the last SNP and their positions are shown. Names are colored according to the type of association.
