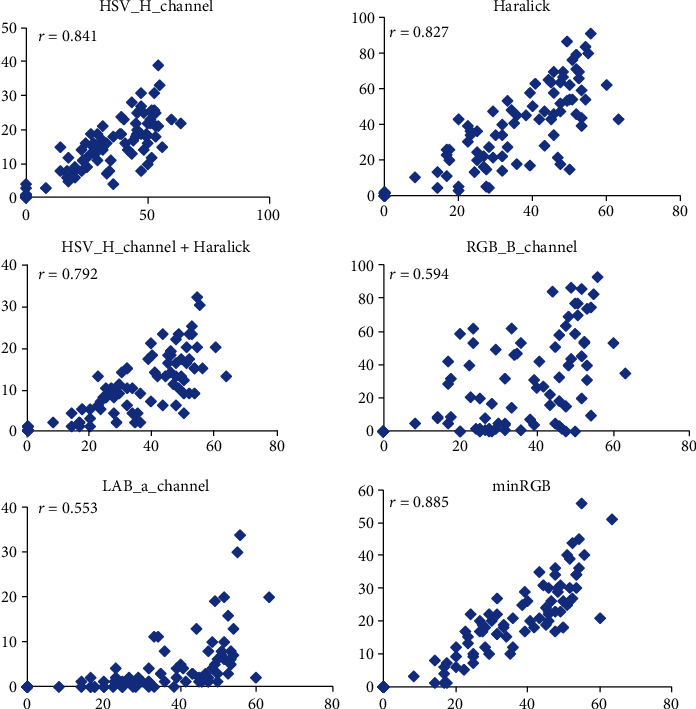
Figure 8.

Scatter plots and Pearson's coefficients of correlations (r) for the different machine learning models plus the minRGB-based segmentation (y-axis) versus the mean visual scores given by six experts (x-axis). PM infected detached barley leaves, 6 dai. The number of samples (n = 108).
