Figure 5.

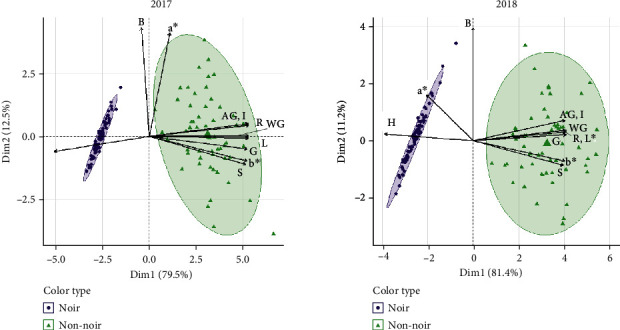
Combined PCA biplot for RGB, L∗a∗b∗, and HSI color in 2017 and 2018. Arrows indicate traits while circles and triangles represent each individual, coded by color.

Combined PCA biplot for RGB, L∗a∗b∗, and HSI color in 2017 and 2018. Arrows indicate traits while circles and triangles represent each individual, coded by color.