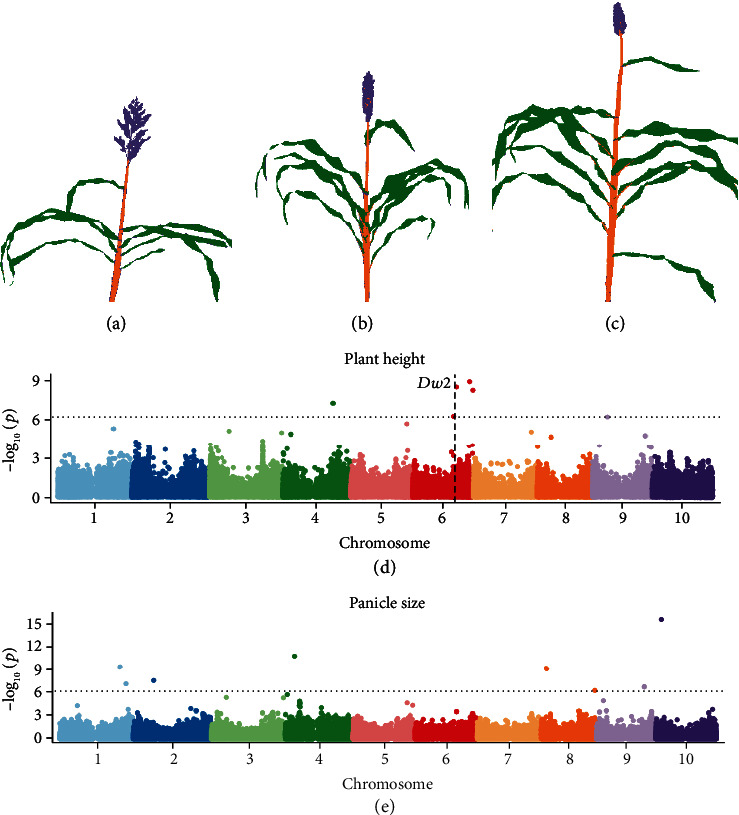
Figure 5.

Mapping genomic regions controlling variation in sorghum phenotypes. (a–c) Examples of LDA-segmented sorghum plant images with short (a), medium (b), and tall (c) heights to apex and small (c), medium (b), and large (a) panicle sizes. (d) Results from a genome-wide association study for plant height to apex measured using results from LDA segmentation of images of 227 sorghum plants. The horizontal dashed line indicates a Bonferroni multiple testing-corrected threshold for statistical significance equivalent to P = 0.05. The vertical dashed line indicates the genomic location of dwarf2, a gene known to control variation in plant height in sorghum. (e) Results from a genome-wide association study for panicle size measured using results from LDA segmentation of images of 227 sorghum plants.
