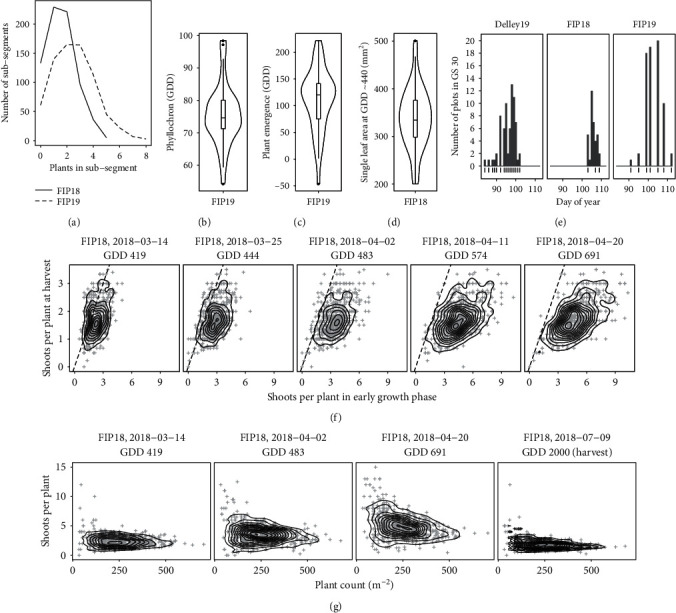
Figure 4.

Manual reference measurements of plant counts (a), phyllochron (b), plant emergence time point (c), leaf area of single leaves around GDD 440 (d), beginning of stem elongation (GS30) (e), contour plot of shoots per plant at specific growing degree days (GDDs) around stem elongation and at harvest (f), and contour plot of shoots per plant for different measured plant densities, specific GDDs, and at harvest (g). The boxes in (b, c, d) show the 25 and 75% percentiles, the solid line represents the median, the whiskers show the 5 and 95% percentile, and the violins show the kernel density distribution. Contours in (f, g) are density contours, dashed lines—1 : 1 lines.
