Figure 5.

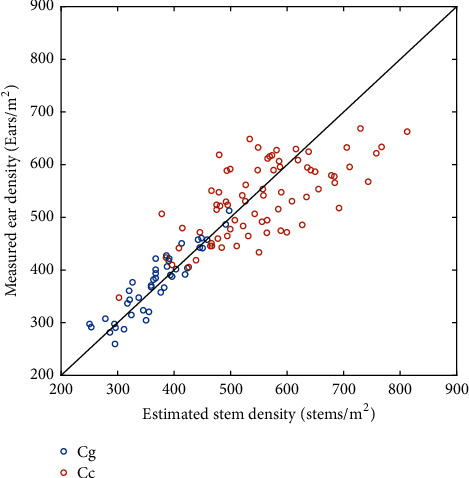
Relationship between the estimated stem density and the measured ear density at the Gréoux (blue dots) and Clermont (red dots) datasets. The black line corresponds to the 1:1 line.

Relationship between the estimated stem density and the measured ear density at the Gréoux (blue dots) and Clermont (red dots) datasets. The black line corresponds to the 1:1 line.