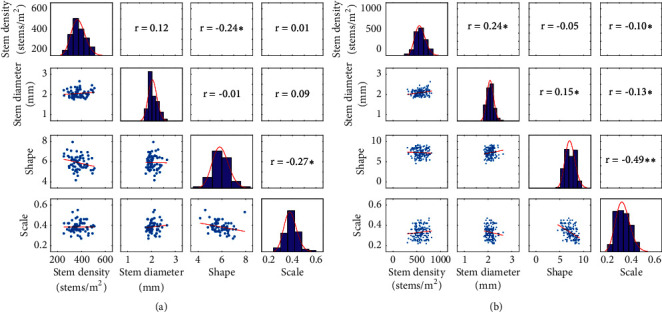
Figure 6.

Correlation and distribution between stem density, average stem diameter, shape, and scale parameters over Gréoux (a) and Clermont (b) experimental sites. The correlation coefficient, r, is given in the upper triangular matrix with ∗∗ and ∗ corresponding, respectively, to significant values at 0.01 and 0.05 probability levels.
