Figure 4.

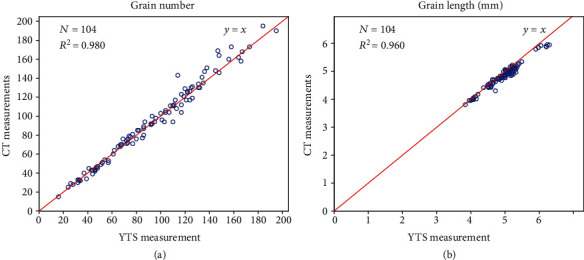
Comparison between the CT and YTS measurements. Performance evaluation for the grain number and grain length. Scatter plots of the CT measurements versus the YTS measurements for the grain number (a) and grain length (b).

Comparison between the CT and YTS measurements. Performance evaluation for the grain number and grain length. Scatter plots of the CT measurements versus the YTS measurements for the grain number (a) and grain length (b).