Figure 8.

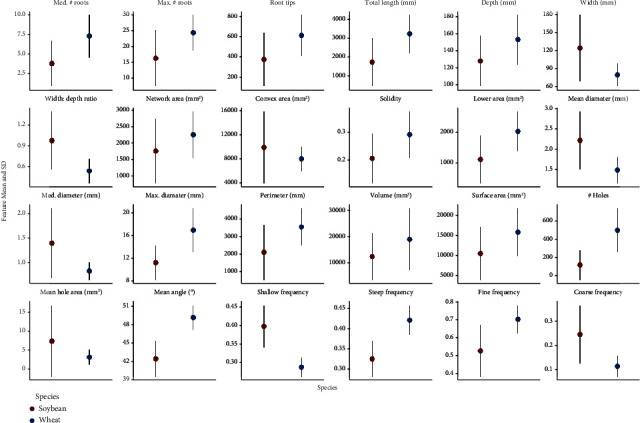
Summary of means and standard deviations of various features extracted from soybean (n = 2,799) and wheat (n = 1,753) root crown images using the RhizoVision Crown platform.

Summary of means and standard deviations of various features extracted from soybean (n = 2,799) and wheat (n = 1,753) root crown images using the RhizoVision Crown platform.