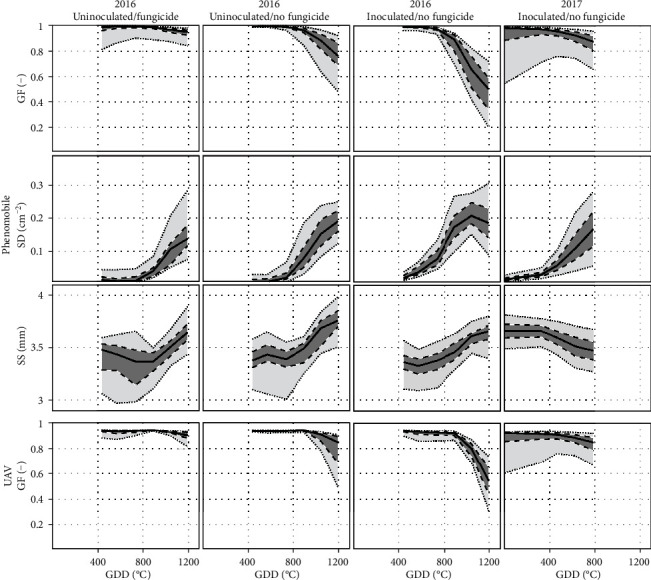
Figure 7.

Temporal courses of GF (row 1), SD (row 2), and SS (row 3) derived from Phenomobile RGB imagery, and GF derived from UAV multispectral imagery (row 4), for 2016 (columns 1-3) and 2017 (column 4). For 2016, the three treatments studied are shown: no inoculation and fungicide application (column 1), no inoculation and no fungicide application (column 2), and inoculation and no fungicide application (column 3). For 2017, only one treatment is studied: inoculation and no fungicide application (column 4). For each plot, the solid line shows the median value over all microplots, the dark gray area delimits the 25th and 75th percentiles, and the light gray area delimits the 10th and 90th percentiles. Time is expressed in growing degree days (GDD) after disease inoculation.
